Daniocell
rmdn2 (mesenchyme)
regulator of microtubule dynamics 2
ZFIN
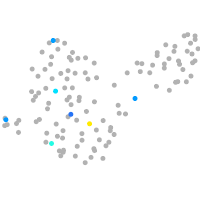
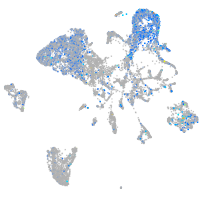
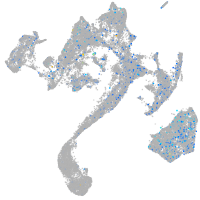
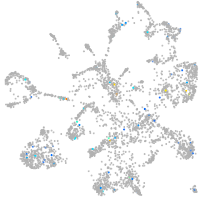
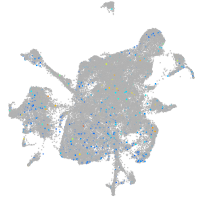
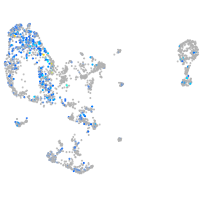
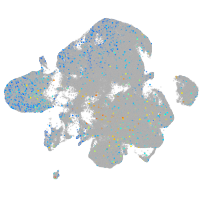
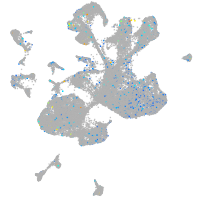
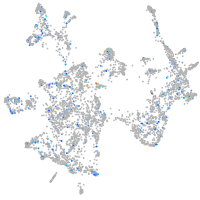
Gene expression UMAP
Display:
Expression
Stage
Other cell groups
all cells
blastomeres
PGCs
endoderm
axial mesoderm
muscle
mural cells /
non-skeletal muscle
mesenchyme
hematopoietic /
vasculature
pronephros
neural
spinal cord / glia
eye
taste / olfactory
otic / lateral line
epidermis
periderm
fin
ionocytes / mucous
pigment cells
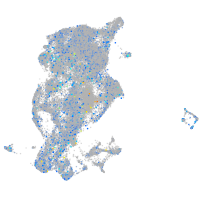
Expression by stage/cluster
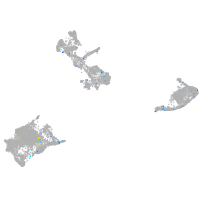
Correlated gene expression
Positive correlation
Negative correlation
Gene
r
Gene
r
LOC108183612
0.065
rpl39
-0.031
LOC100334557
0.063
rpl37
-0.026
si:dkeyp-4c4.1
0.058
si:dkey-151g10.6
-0.024
apobec2b
0.058
rps29
-0.023
crhr2.2
0.055
sparc
-0.020
si:busm1-160c18.6
0.051
itga10
-0.020
rnf32
0.051
nme2b.1
-0.020
XLOC-000339
0.049
rps28
-0.018
AL732629.1
0.046
rpl36a
-0.017
XLOC-017114
0.046
rpl38
-0.017
AL935126.2
0.046
rpl36
-0.017
tmem158
0.045
rpl27a
-0.017
CABZ01081830.2
0.044
rplp1
-0.017
LO018363.2
0.044
agmo
-0.016
rce1b
0.043
zgc:162730
-0.016
abcg2b
0.041
rplp2
-0.016
BX927219.1
0.041
vwde
-0.016
rasal1b
0.040
bhmt
-0.016
gpr185a
0.040
rpl35a
-0.016
LOC108191643.1
0.039
olfml3b
-0.015
LOC100334677
0.039
rpl29
-0.015
trim71
0.038
matn4
-0.015
CABZ01109481.1
0.038
pdk2b
-0.015
LOC101884482
0.038
rps12
-0.015
SLC45A4 (1 of many)
0.037
rpl22
-0.015
CR944667.3
0.036
pvalb1
-0.015
LOC110439582
0.036
rps24
-0.015
LOC101885809
0.036
col2a1b
-0.015
fer1l4
0.035
zgc:113531
-0.014
lin28a
0.035
fxyd1
-0.014
mkrn2os.2
0.035
VIT
-0.014
BX005012.4
0.035
col2a1a
-0.014
BX649300.1
0.034
crybg1b
-0.014
nitr3a
0.034
cnmd
-0.014
mpp5b
0.034
prss35
-0.014