Daniocell
rgs7bpb (periderm)
regulator of G protein signaling 7 binding protein b
ZFIN
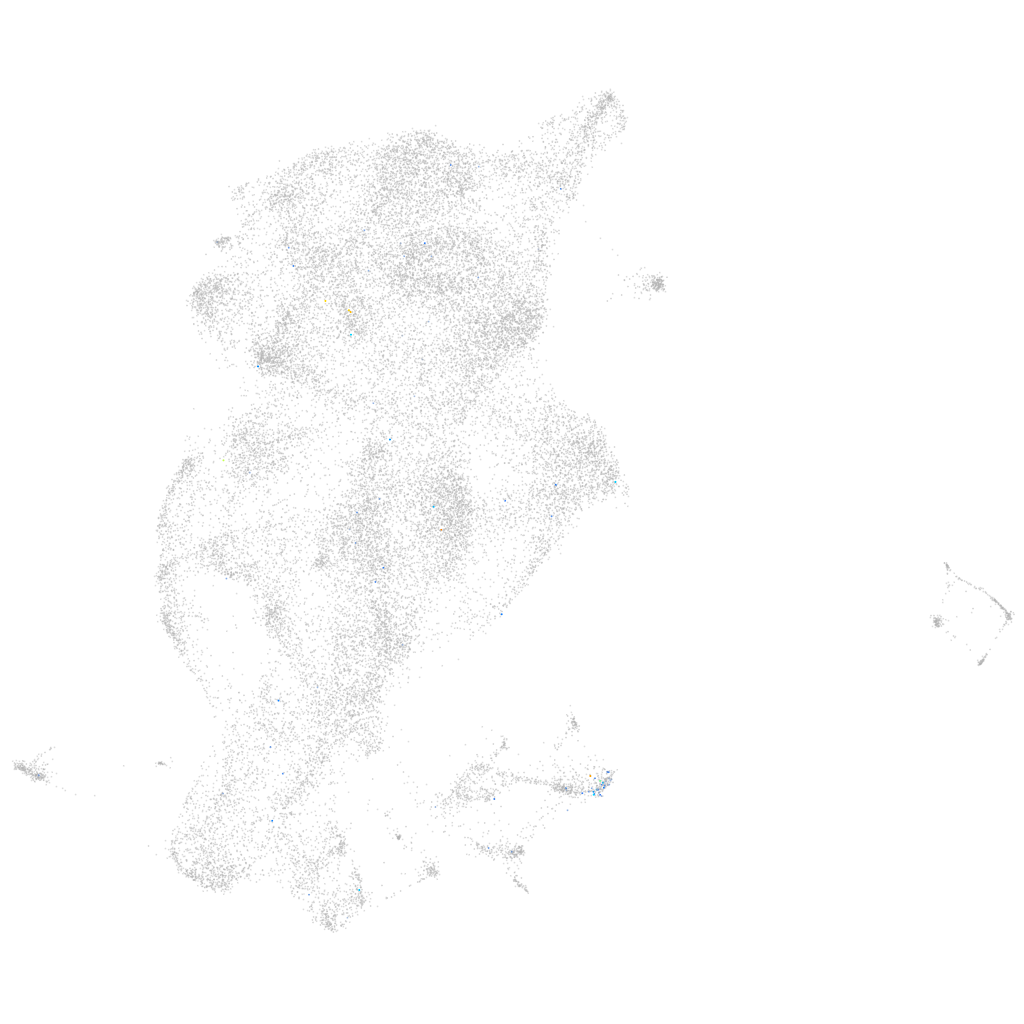
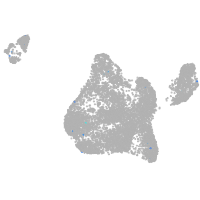
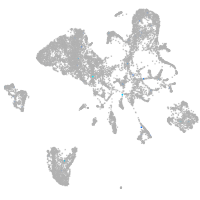
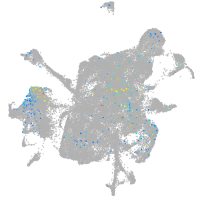
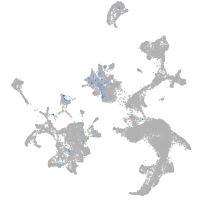
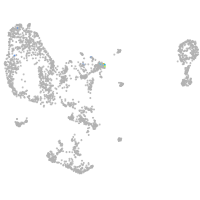
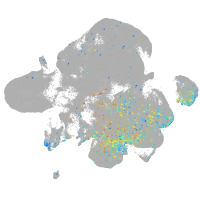
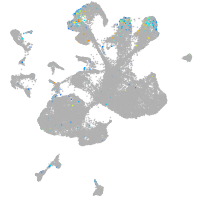
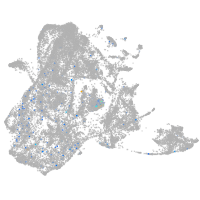
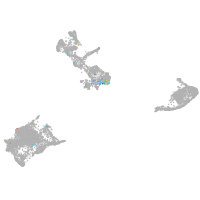
Gene expression UMAP
Display:
Expression
Stage
Other cell groups
all cells
blastomeres
PGCs
endoderm
axial mesoderm
muscle
mural cells /
non-skeletal muscle
mesenchyme
hematopoietic /
vasculature
pronephros
neural
spinal cord / glia
eye
taste / olfactory
otic / lateral line
epidermis
periderm
fin
ionocytes / mucous
pigment cells
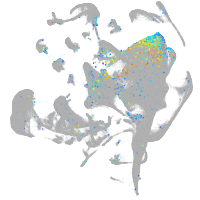
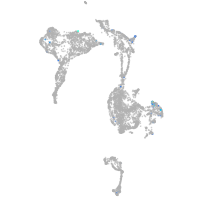
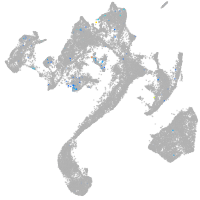
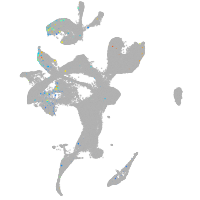
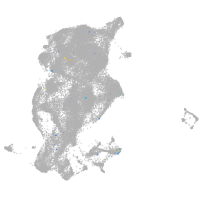
Expression by stage/cluster
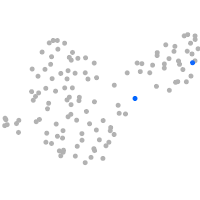
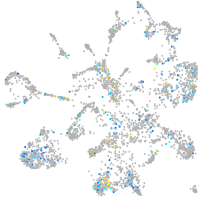
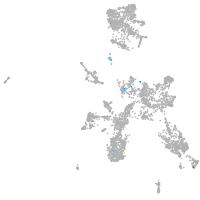
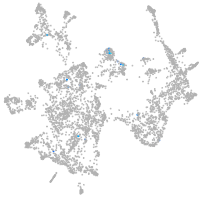
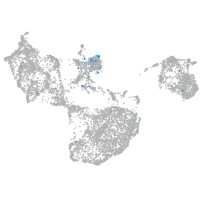
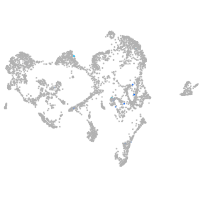
Correlated gene expression
Positive correlation
Negative correlation
Gene
r
Gene
r
or125-5
0.298
anxa1a
-0.034
si:dkey-183i3.9
0.254
s100a10b
-0.033
B3GAT1
0.236
agr1
-0.033
bsna
0.234
cfl1l
-0.030
LOC108190036
0.216
krt4
-0.030
XLOC-019883
0.205
wu:fb18f06
-0.026
pcdh2ab10
0.196
ckap4
-0.026
LOC108191529
0.195
icn
-0.024
mir132-1
0.189
serbp1a
-0.023
XLOC-000086
0.187
rps15
-0.022
mir129-1
0.181
cyt1l
-0.022
alpk3b
0.179
NC-002333.17
-0.021
si:dkey-225f23.5
0.176
zgc:193505
-0.021
LOC101884985
0.167
cyt1
-0.021
grm6a
0.166
zgc:163030
-0.021
nxph3
0.164
rack1
-0.021
CT583652.1
0.161
adipor2
-0.021
ampd3a
0.161
anxa1c
-0.021
gabbr2
0.160
mgst2
-0.020
si:ch73-344o19.1
0.158
zgc:56493
-0.020
tprg1l
0.157
zgc:153284
-0.020
si:dkey-35i13.1
0.157
tdh
-0.020
CABZ01092942.1
0.155
capns1b
-0.019
syt12
0.152
tmsb1
-0.019
efr3ba
0.149
glo1
-0.019
mir132-2
0.147
rpl12
-0.019
XLOC-010548
0.147
cavin2b
-0.018
syngr3a
0.146
zgc:175088
-0.018
ssh1b
0.145
rpl17
-0.018
sept5b
0.143
tmem238a
-0.018
XLOC-005779
0.143
net1
-0.018
trhra
0.142
rps29
-0.018
gpr186
0.140
stx11b.1
-0.018
BX936308.1
0.140
rps15a
-0.018
cacna1c
0.139
rplp2
-0.018