Daniocell
rfx7a (hematopoietic / vasculature)
regulatory factor X7a
ZFIN
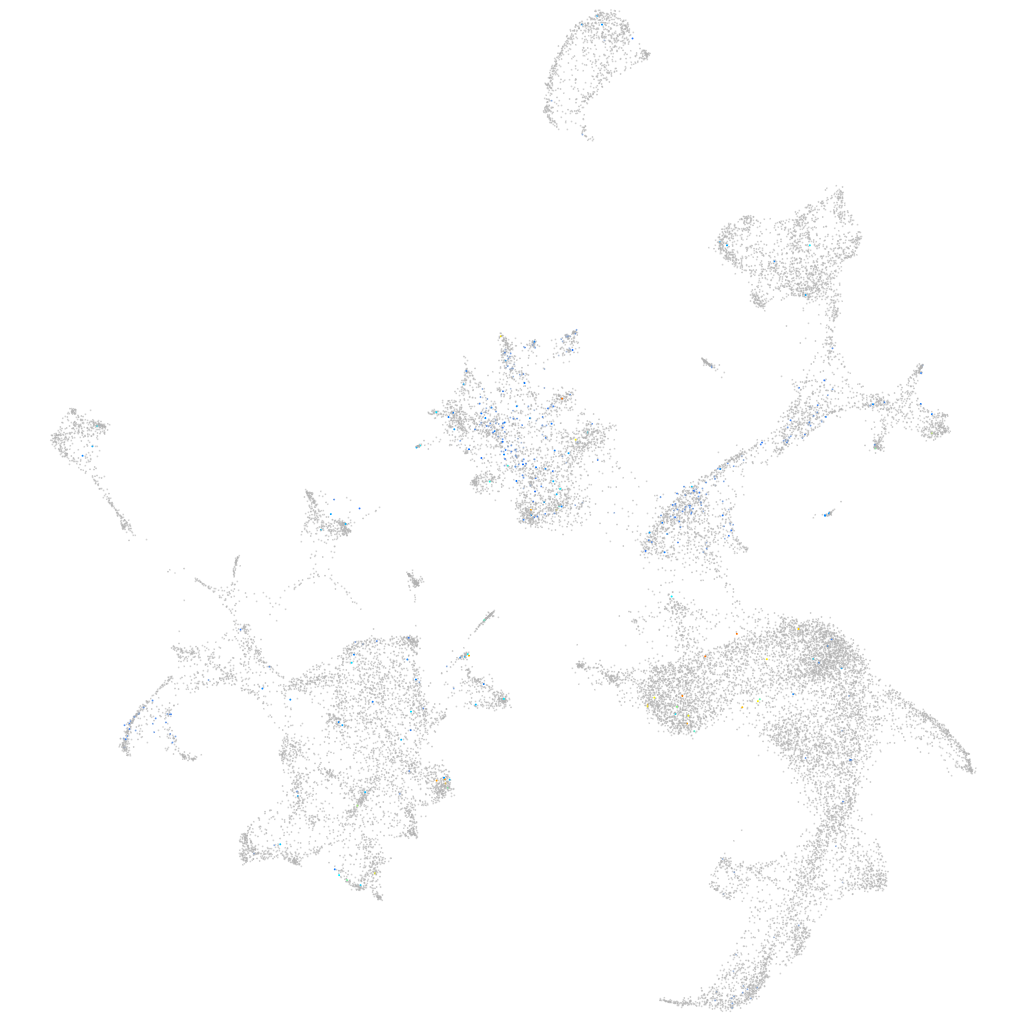
Gene expression UMAP
Display:
Expression
Stage
Other cell groups
all cells
blastomeres
PGCs
endoderm
axial mesoderm
muscle
mural cells /
non-skeletal muscle
mesenchyme
hematopoietic /
vasculature
pronephros
neural
spinal cord / glia
eye
taste / olfactory
otic / lateral line
epidermis
periderm
fin
ionocytes / mucous
pigment cells
Expression by stage/cluster
Correlated gene expression
Positive correlation
Negative correlation
Gene
r
Gene
r
CU459174.1
0.167
hbbe3
-0.037
LOC108179562
0.104
zgc:163057
-0.029
si:ch211-236p22.1
0.104
alas2
-0.028
XLOC-019042
0.099
zgc:56095
-0.026
CR354372.1
0.097
hbbe1.2
-0.025
CABZ01111555.1
0.096
cahz
-0.023
trim35-3
0.095
hbae1.3
-0.020
LO018231.1
0.095
ctss2.1
-0.020
LOC110437725
0.091
fthl31
-0.019
si:ch73-206d17.1
0.090
tspo
-0.019
si:ch211-277e21.1
0.090
hmbsb
-0.019
asb16
0.089
gp9
-0.019
XLOC-034223
0.089
coq10b
-0.018
LOC103909450
0.088
havcr1
-0.018
LOC101887043
0.086
ncf1
-0.018
AL772241.2
0.086
blvrb
-0.018
LOC110440032
0.085
si:ch211-147m6.1
-0.018
FQ377605.1
0.085
ctss2.2
-0.018
CABZ01050944.1
0.083
ak3
-0.018
LOC100000545
0.082
si:dkey-5n18.1
-0.017
CABZ01081777.1
0.081
zgc:163061
-0.017
olfml2bb
0.081
spi1b
-0.017
zmp:0000000629
0.079
cybb
-0.017
fhdc1
0.079
mfap4
-0.017
CABZ01003344.1
0.076
ltb4r
-0.017
BX936303.2
0.075
fcer1gl
-0.017
fat1b
0.075
si:ch211-243a20.4
-0.017
si:ch1073-44g3.1
0.074
fam210b
-0.016
LOC101886774
0.074
rhd
-0.016
LOC110438807
0.072
slc11a2
-0.016
dpp4
0.071
txn
-0.016
tmem240b
0.071
glipr1a
-0.016
LOC108181097
0.071
hbae5
-0.016
znf1034
0.070
si:ch211-102c2.4
-0.016
chl1b
0.069
ccl34a.4
-0.016