Daniocell
rbl2 (mesenchyme)
retinoblastoma-like 2 (p130)
ZFIN
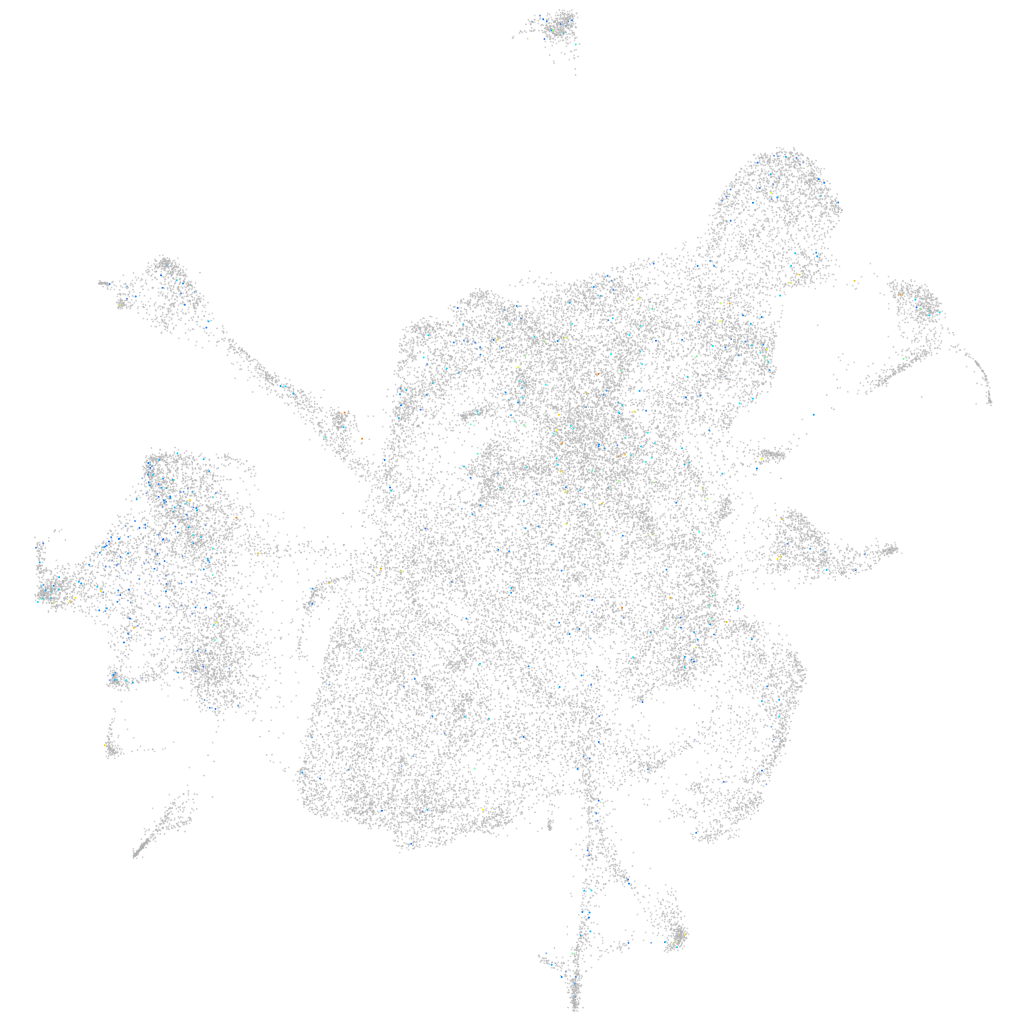
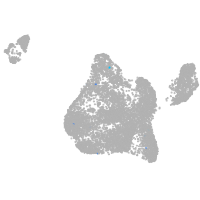
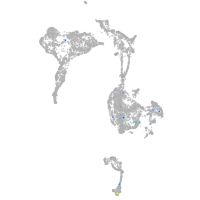
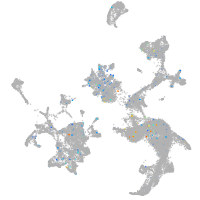
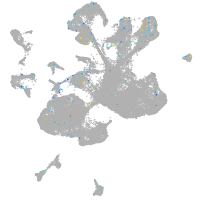
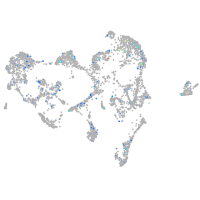
Gene expression UMAP
Display:
Expression
Stage
Other cell groups
all cells
blastomeres
PGCs
endoderm
axial mesoderm
muscle
mural cells /
non-skeletal muscle
mesenchyme
hematopoietic /
vasculature
pronephros
neural
spinal cord / glia
eye
taste / olfactory
otic / lateral line
epidermis
periderm
fin
ionocytes / mucous
pigment cells
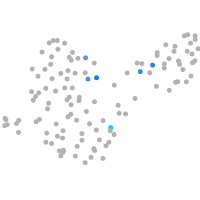
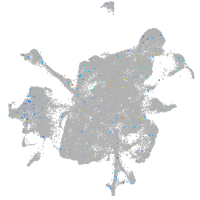
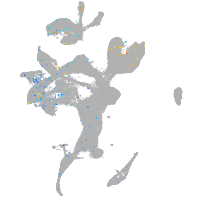
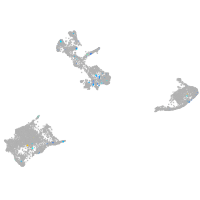
Expression by stage/cluster
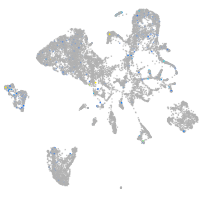
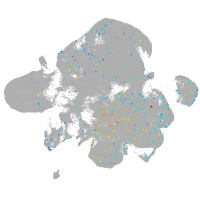
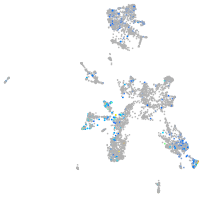
Correlated gene expression
Positive correlation
Negative correlation
Gene
r
Gene
r
LOC103911966
0.102
rps12
-0.045
BX842702.1
0.086
rps23
-0.043
LOC100536629
0.082
rpl39
-0.042
CR352226.1
0.068
rps20
-0.041
BX649385.1
0.066
hmgb2a
-0.041
XLOC-005048
0.064
rpl12
-0.041
si:ch73-54n14.2
0.063
si:dkey-151g10.6
-0.040
gabra1
0.060
rps27a
-0.040
CR774189.1
0.059
rpl37
-0.038
BX005108.2
0.058
rps19
-0.038
BX537162.1
0.057
rps15a
-0.037
LOC110438909
0.055
ran
-0.037
LOC110439576
0.055
rplp1
-0.037
CABZ01088346.1
0.053
hmgb2b
-0.036
LOC103908683.1
0.053
stmn1a
-0.036
XLOC-022900
0.053
cbx3a
-0.036
LOC110439366
0.053
rpl32
-0.036
LOC110439128.1
0.051
rplp0
-0.036
pcbp3
0.050
rpl7
-0.036
igic1s1
0.050
rps7
-0.035
dscaml1
0.050
rps13
-0.035
ftr19
0.049
rps24
-0.035
MARCH4 (1 of many)
0.049
rps5
-0.034
car15
0.048
rpl10a
-0.034
ckbb
0.048
rpl8
-0.034
scn4aa
0.048
rplp2l
-0.034
loxhd1a
0.048
dut
-0.033
snap25b
0.047
rpl7a
-0.033
CU929360.1
0.047
rpl36a
-0.033
atp6ap1a
0.047
faua
-0.033
si:ch73-352p18.4
0.046
rps10
-0.033
si:dkey-11o15.5
0.046
rpl19
-0.033
ghsrb
0.046
pcna
-0.033
rnasekb
0.046
rpl35
-0.033
iqsec3b
0.046
tuba8l4
-0.033