Daniocell
rasd1 (blastomeres)
"RAS, dexamethasone-induced 1"
ZFIN
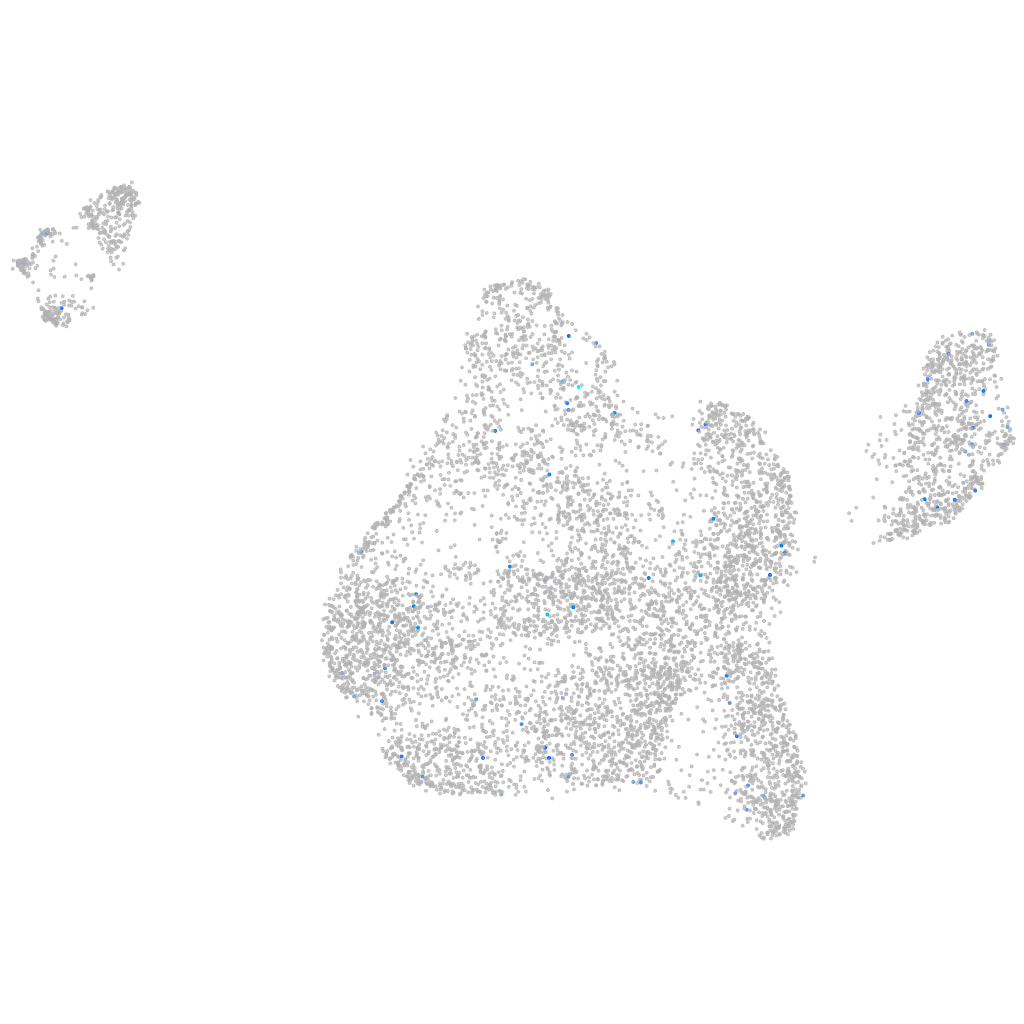
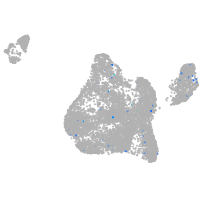
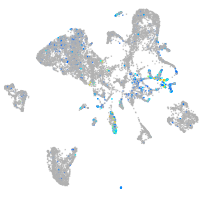
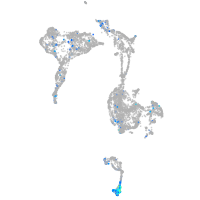
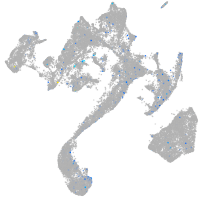
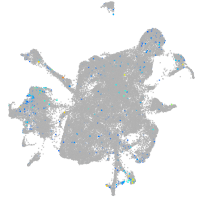
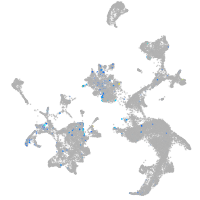
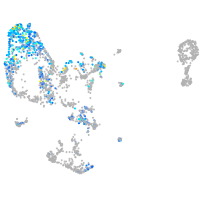
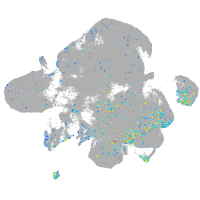
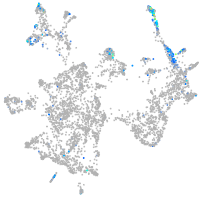
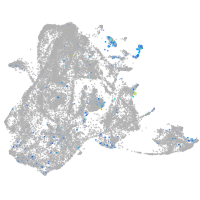
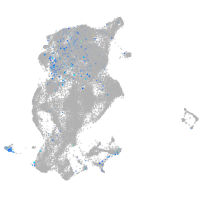
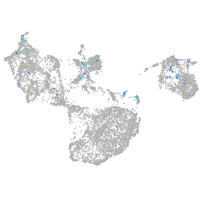
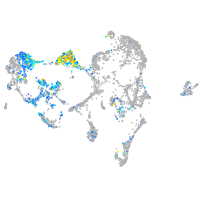
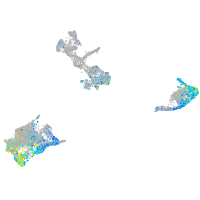
Gene expression UMAP
Display:
Expression
Stage
Other cell groups
all cells
blastomeres
PGCs
endoderm
axial mesoderm
muscle
mural cells /
non-skeletal muscle
mesenchyme
hematopoietic /
vasculature
pronephros
neural
spinal cord / glia
eye
taste / olfactory
otic / lateral line
epidermis
periderm
fin
ionocytes / mucous
pigment cells
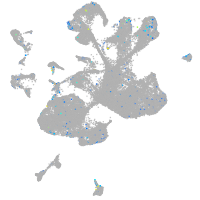
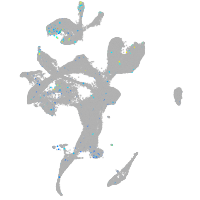
Expression by stage/cluster
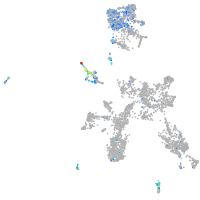
Correlated gene expression
Positive correlation
Negative correlation
Gene
r
Gene
r
XLOC-011522
0.202
foxh1
-0.034
CMKLR1
0.176
rpl35a
-0.031
angptl2b
0.159
cdkn1bb
-0.029
si:ch211-277e21.1
0.154
mcm2
-0.029
tfcp2l1
0.152
ppwd1
-0.029
ugt5b3
0.146
hells
-0.029
marveld1
0.138
gnb1b
-0.029
si:dkey-221l4.10
0.134
senp3a
-0.028
LOC103910566
0.133
xrn2
-0.027
CT583728.4
0.132
nop2
-0.027
wnt1
0.131
ptbp2a
-0.026
ccl33.2
0.130
atp5pf
-0.026
BX890562.2
0.129
dhx38
-0.026
sult1st2
0.129
bcl7a
-0.026
LOC103910741
0.129
gpatch1
-0.026
BX897662.1
0.123
nudcd3
-0.026
LOC103908968
0.118
apoc1
-0.026
XLOC-014532
0.118
si:ch73-347e22.4
-0.026
rnasel2
0.117
bambia
-0.026
XLOC-000324
0.112
ngdn
-0.025
CABZ01044048.1
0.109
klf2b
-0.025
ceacam1
0.108
hnrnpul1l
-0.025
bhlha15
0.107
si:ch211-214e3.5
-0.024
omd
0.107
faua
-0.024
foxo1a
0.106
ube2v2
-0.024
sult3st4
0.104
cad
-0.024
si:ch211-278p9.2
0.104
atic
-0.024
hcrtr2
0.101
clptm1
-0.024
XLOC-014039
0.101
dpy30
-0.024
XLOC-013065
0.100
ved
-0.024
emilin1a
0.100
psip1b
-0.024
cluhb
0.099
ccnb3
-0.023
olfml1
0.099
rps2
-0.023
ccdc65
0.099
cox4i1
-0.023
si:dkey-18p12.4
0.097
mettl21a
-0.023