Daniocell
rasa3 (pigment cells)
RAS p21 protein activator 3
ZFIN
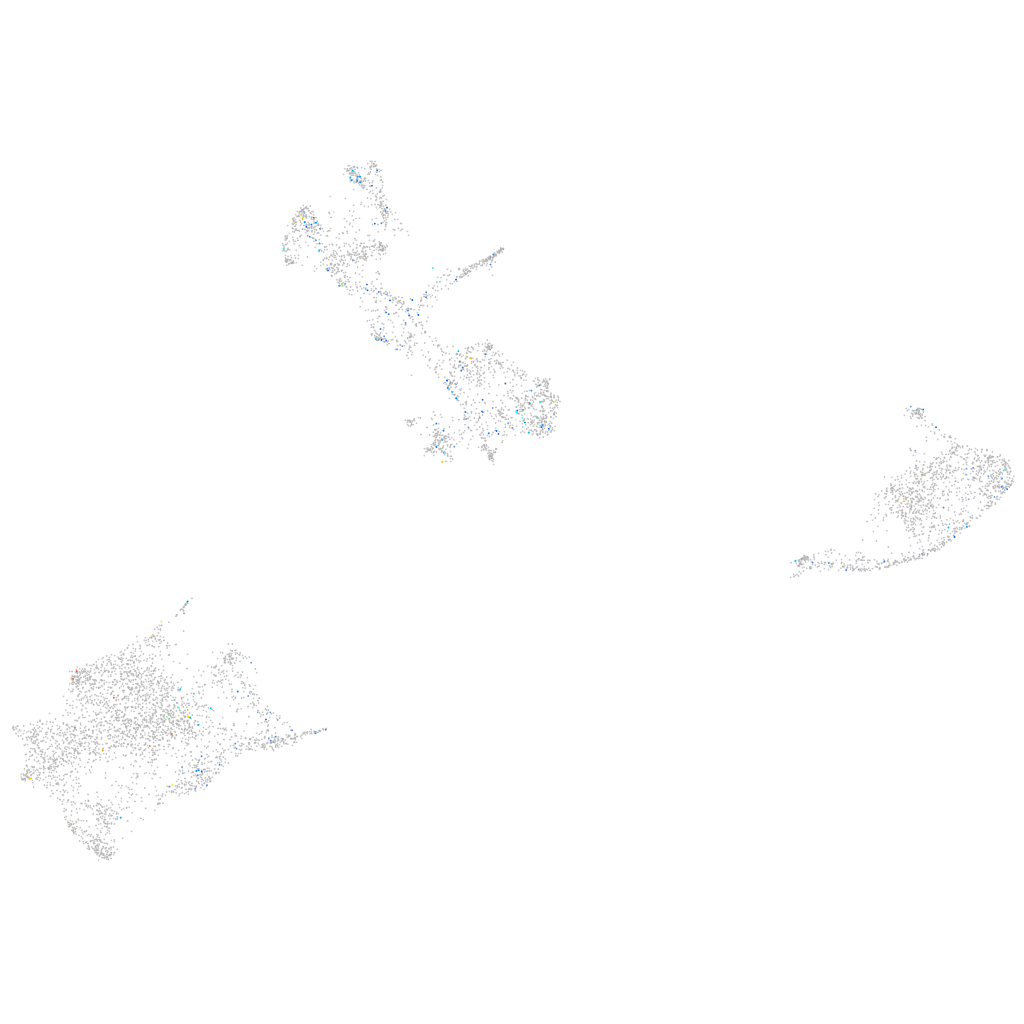
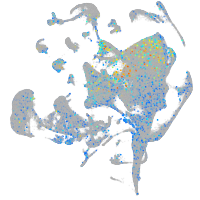
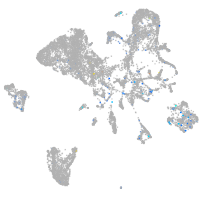
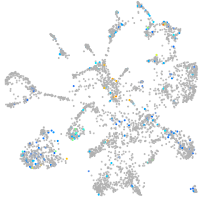
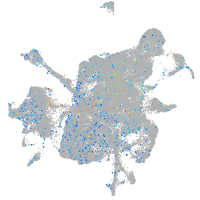
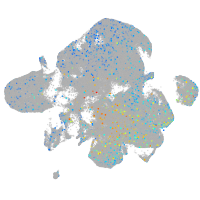
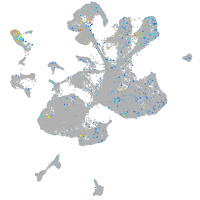
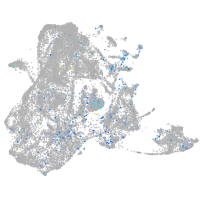
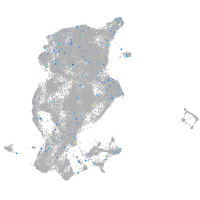
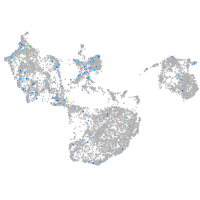
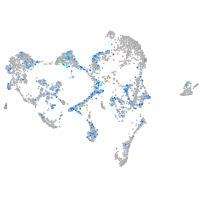
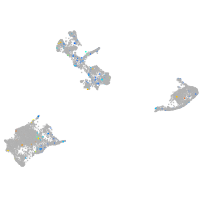
Gene expression UMAP
Display:
Expression
Stage
Other cell groups
all cells
blastomeres
PGCs
endoderm
axial mesoderm
muscle
mural cells /
non-skeletal muscle
mesenchyme
hematopoietic /
vasculature
pronephros
neural
spinal cord / glia
eye
taste / olfactory
otic / lateral line
epidermis
periderm
fin
ionocytes / mucous
pigment cells
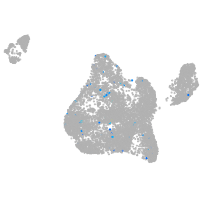
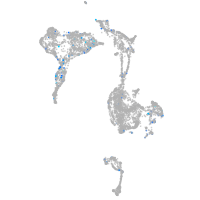
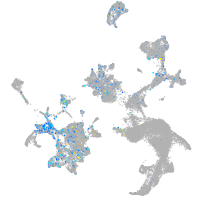
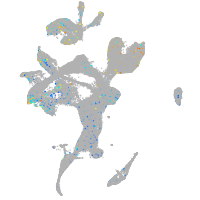
Expression by stage/cluster
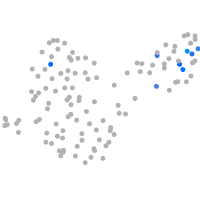
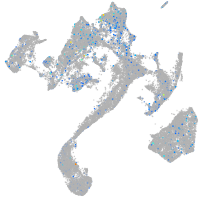
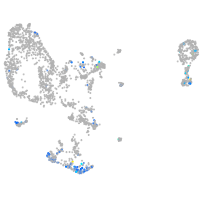
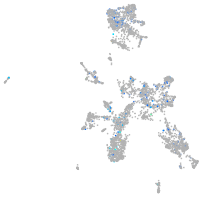
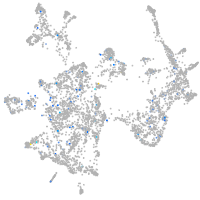
Correlated gene expression
Positive correlation
Negative correlation
Gene
r
Gene
r
pip4k2cb
0.151
akr1b1
-0.056
lrrc24
0.144
gch2
-0.049
cbln12
0.142
pts
-0.046
CR450777.1
0.141
zgc:110339
-0.042
FP236513.1
0.137
cd63
-0.041
il1b
0.136
gstt1a
-0.040
BX649516.2
0.136
slc22a7a
-0.040
XLOC-036186
0.117
si:dkey-251i10.2
-0.039
znf1020
0.116
cotl1
-0.038
qdprb2
0.115
reep5
-0.038
XLOC-034167
0.115
CABZ01021592.1
-0.037
si:dkeyp-79b7.3
0.113
gstp1
-0.037
anpepa
0.111
tmem130
-0.033
LOC101882203
0.109
myhz1.1
-0.032
LOC100536746
0.109
cdo1
-0.032
LOC103910381
0.109
prdx1
-0.031
LOC103909475
0.108
anxa11b
-0.031
AL935044.2
0.105
tmem243a
-0.031
FO904966.1
0.105
fabp3
-0.030
si:dkeyp-117b11.1
0.103
pcbd1
-0.030
arhgef38
0.102
mylpfb
-0.030
si:dkey-16n15.6
0.100
cdh1
-0.030
pax9
0.099
ttn.2
-0.029
CU681841.1
0.099
actb2
-0.029
il17rd
0.098
noctb
-0.029
ptpn12
0.098
TMEM19
-0.029
gzm3.3
0.097
anxa1a
-0.029
LOC101884096
0.097
icn
-0.029
LOC110439356
0.097
aldob
-0.028
XLOC-039167
0.097
tspan36
-0.028
ghrh
0.096
rnaseka
-0.028
znf1147
0.096
gpd1b
-0.028
si:dkey-121n8.7
0.095
actc1b
-0.027
c1ql3b
0.095
csrp2
-0.027
LO018196.1
0.095
vps26a
-0.027