Daniocell
rai14 (pigment cells)
retinoic acid induced 14
ZFIN
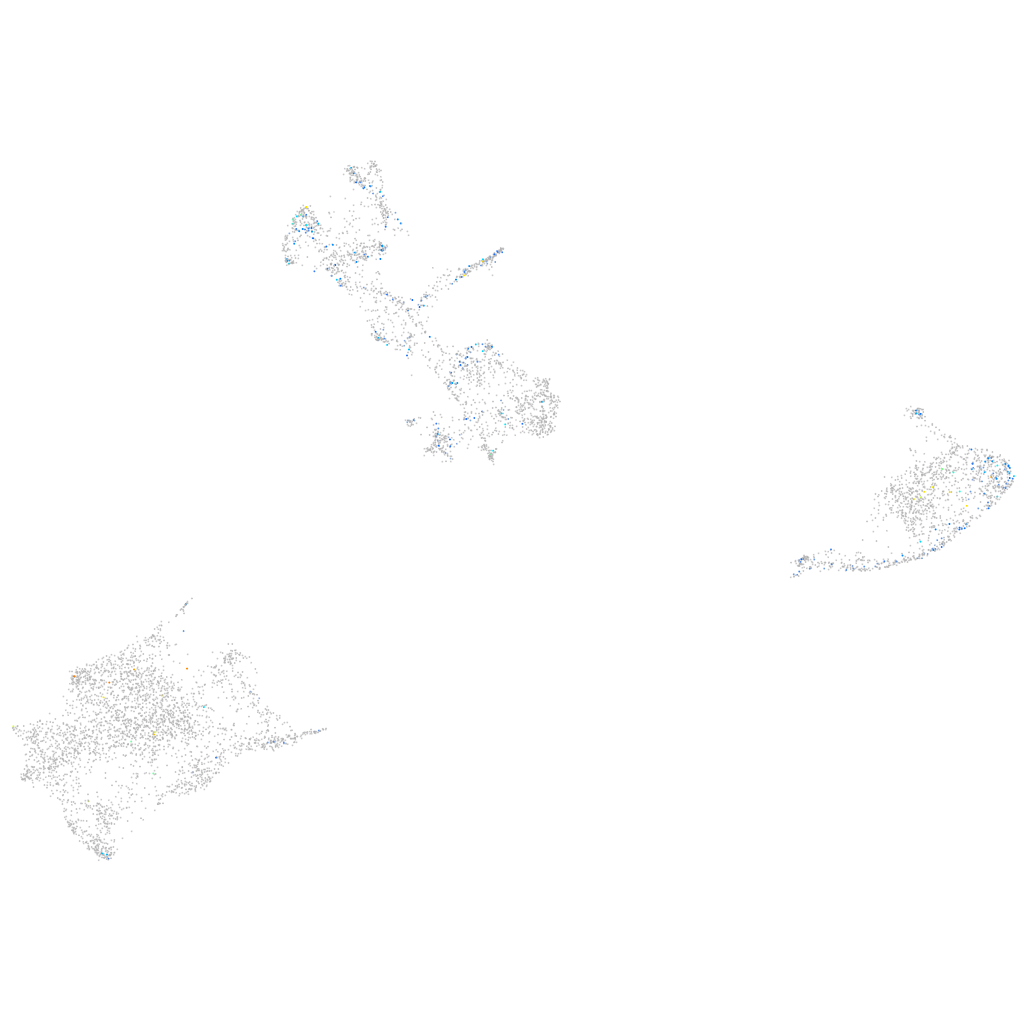
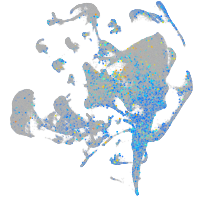
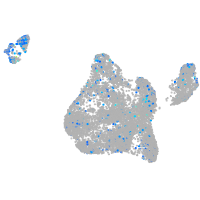
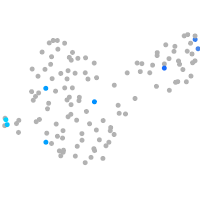
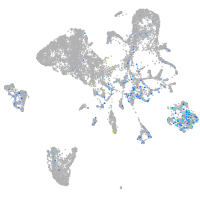
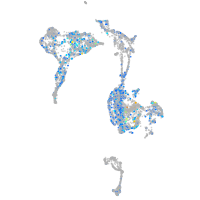
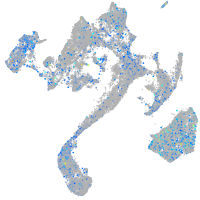
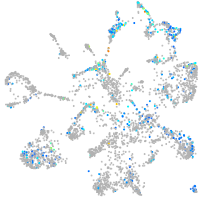
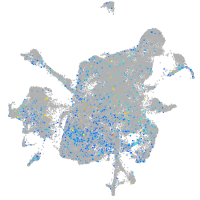
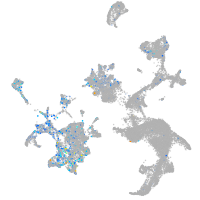
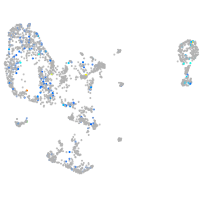
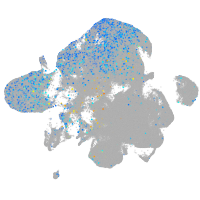
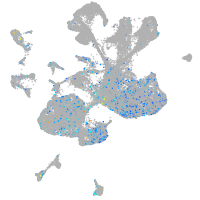
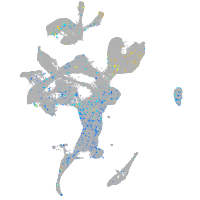
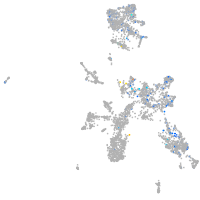
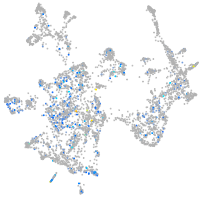
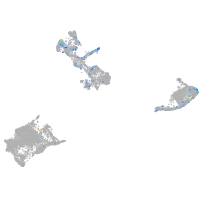
Gene expression UMAP
Display:
Expression
Stage
Other cell groups
all cells
blastomeres
PGCs
endoderm
axial mesoderm
muscle
mural cells /
non-skeletal muscle
mesenchyme
hematopoietic /
vasculature
pronephros
neural
spinal cord / glia
eye
taste / olfactory
otic / lateral line
epidermis
periderm
fin
ionocytes / mucous
pigment cells
Expression by stage/cluster
Correlated gene expression
Positive correlation
Negative correlation
Gene
r
Gene
r
col4a3
0.174
CABZ01021592.1
-0.110
LOC101885086
0.142
si:dkey-251i10.2
-0.107
LOC108190733
0.137
gch2
-0.099
znf1175
0.130
tmem130
-0.087
trnW
0.128
akr1b1
-0.083
mfsd7
0.117
pts
-0.082
dgkab
0.113
slc22a7a
-0.082
LOC103909099
0.112
gpd1b
-0.078
BX465864.1
0.109
aox5
-0.076
hpse
0.109
si:ch211-251b21.1
-0.075
lrrc30a
0.103
slc2a11b
-0.071
fgf24
0.103
uraha
-0.069
znf526
0.103
TMEM19
-0.064
col4a1
0.102
bscl2l
-0.064
XLOC-005179
0.101
cyb5a
-0.063
XLOC-038902
0.100
zgc:110339
-0.063
CR936300.1
0.099
cx30.3
-0.063
plecb
0.097
bco1
-0.062
slc29a1a
0.097
gstp1
-0.061
si:dkey-175m17.6
0.097
pax7b
-0.060
atp1b1a
0.096
sprb
-0.059
ptgdsa
0.095
aqp3a
-0.058
tdp2a
0.093
cax1
-0.058
XLOC-005432
0.092
sult1st1
-0.058
CU469539.1
0.091
aldob
-0.056
si:dkey-33m11.8
0.090
cyb561a3b
-0.054
FP103005.2
0.090
si:ch211-194k22.8
-0.054
dnah3
0.090
mibp
-0.053
nup210
0.090
asip2b
-0.053
LOC100334666
0.090
prdx1
-0.052
CR318624.2
0.089
pon1
-0.052
CR318673.1
0.088
prtfdc1
-0.050
CABZ01067754.1
0.088
rbp4l
-0.047
LOC103910597
0.088
oacyl
-0.046
cnn3a
0.088
zgc:153031
-0.046