Daniocell
ptprt (pigment cells)
protein tyrosine phosphatase receptor type T
ZFIN
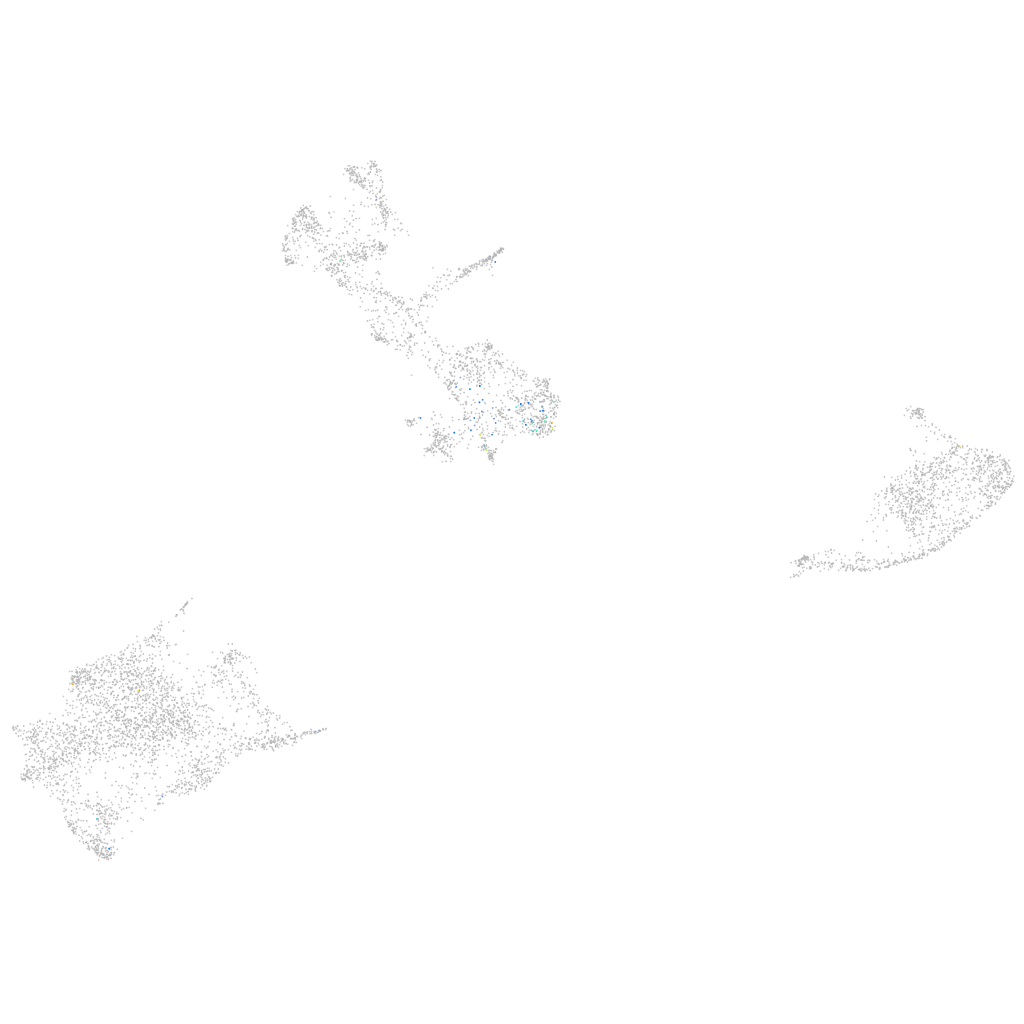
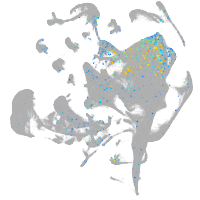
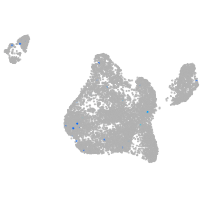
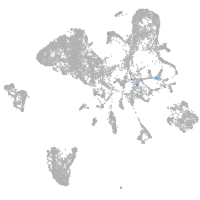
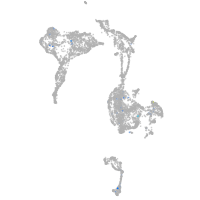
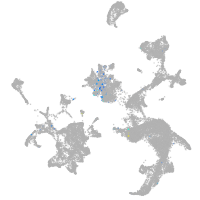
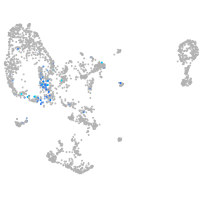
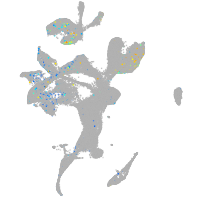
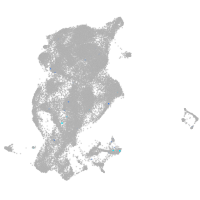
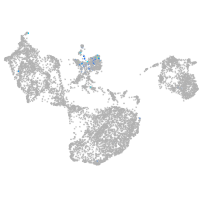
Gene expression UMAP
Display:
Expression
Stage
Other cell groups
all cells
blastomeres
PGCs
endoderm
axial mesoderm
muscle
mural cells /
non-skeletal muscle
mesenchyme
hematopoietic /
vasculature
pronephros
neural
spinal cord / glia
eye
taste / olfactory
otic / lateral line
epidermis
periderm
fin
ionocytes / mucous
pigment cells
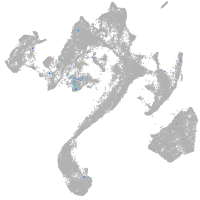
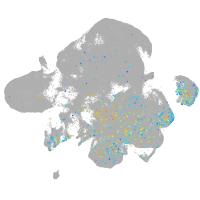
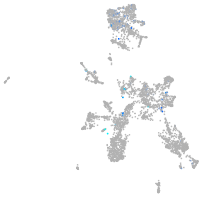
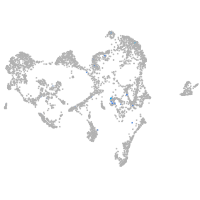
Expression by stage/cluster
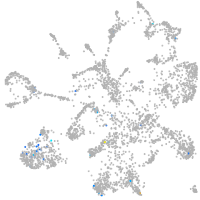
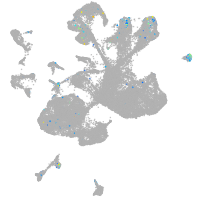
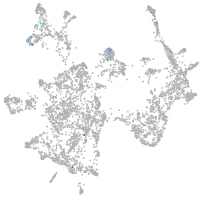
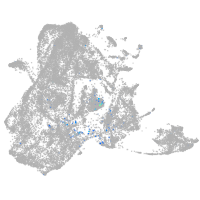
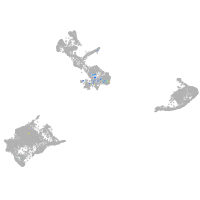
Correlated gene expression
Positive correlation
Negative correlation
Gene
r
Gene
r
si:rp71-1h3.1
0.279
rps7
-0.065
xkr6a
0.233
si:dkey-151g10.6
-0.061
si:dkey-222p3.1
0.233
tspan36
-0.056
CU914550.1
0.232
rpl12
-0.056
LOC100330441
0.214
pfn1
-0.054
BX901883.2
0.211
rps28
-0.053
si:dkeyp-82h4.1
0.209
rps2
-0.053
grik5
0.204
eno3
-0.052
XLOC-017229
0.195
gpr143
-0.052
LOC108180805
0.194
rpl36a
-0.052
gfra4b
0.194
qdpra
-0.048
si:ch211-234p6.5
0.193
bace2
-0.048
znf987
0.192
rpl3
-0.046
LOC103909988
0.190
cst14a.2
-0.045
si:dkey-11f4.7
0.190
zgc:110339
-0.045
gria4a
0.190
rps11
-0.045
LOC110437988
0.188
rps17
-0.044
LOC108182890
0.187
rps29
-0.044
SHISAL2A
0.184
eef1a1l1
-0.044
tnnt2b
0.181
rab32a
-0.043
FOXN2 (1 of many)
0.181
rps12
-0.043
XLOC-036961
0.178
slc37a2
-0.043
si:dkey-27p18.5
0.177
paics
-0.042
il1rapl2
0.174
hspa8
-0.041
pimr74
0.174
eef1da
-0.041
gdnfb
0.173
pik3c3
-0.041
LAMP5
0.169
rab1ab
-0.041
kif17
0.169
prdx6
-0.041
CR786577.1
0.168
pttg1ipb
-0.040
zpld1a
0.166
tpt1
-0.040
gpm6aa
0.164
sypl2b
-0.040
CT030129.1
0.164
actb2
-0.040
glipr1b
0.164
slc2a15a
-0.040
pcdh17
0.164
impdh1b
-0.039
XLOC-023835
0.163
rpl5a
-0.039