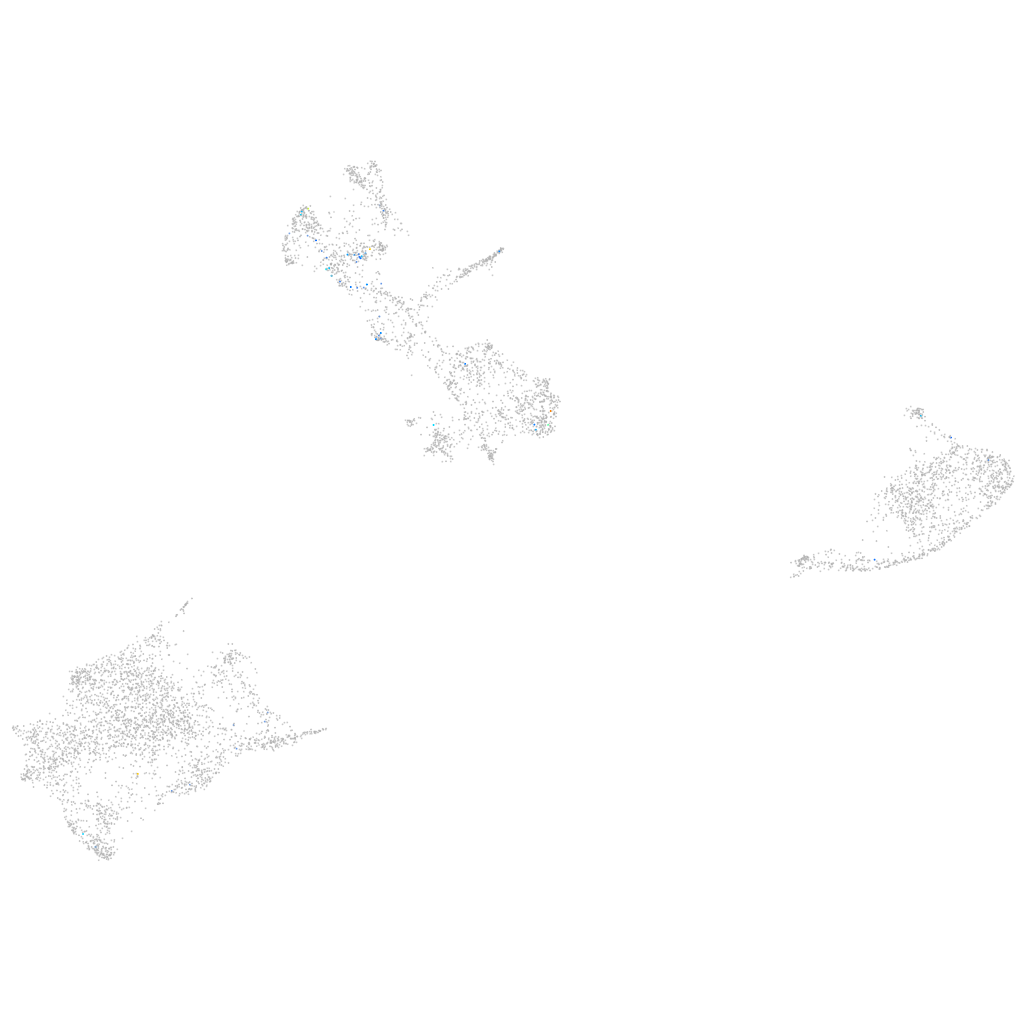
Daniocell
ptger4b (pigment cells)
prostaglandin E receptor 4 (subtype EP4) b
ZFIN
Gene expression UMAP
Display:
Expression
Stage
Other cell groups
all cells
blastomeres
PGCs
endoderm
axial mesoderm
muscle
mural cells /
non-skeletal muscle
mesenchyme
hematopoietic /
vasculature
pronephros
neural
spinal cord / glia
eye
taste / olfactory
otic / lateral line
epidermis
periderm
fin
ionocytes / mucous
pigment cells
Expression by stage/cluster
Correlated gene expression
Positive correlation
Negative correlation
Gene
r
Gene
r
LOC569568
0.375
si:dkey-151g10.6
-0.074
LOC101885382
0.372
gch2
-0.067
vtcn1
0.290
marcksl1b
-0.061
zmp:0000000845
0.286
pts
-0.058
CR405715.1
0.285
tmsb4x
-0.058
FO905027.1
0.253
zgc:110339
-0.055
FO905052.1
0.252
akr1b1
-0.055
BX571828.1
0.248
cotl1
-0.050
CR352243.2
0.231
slc22a7a
-0.046
LOC100538177
0.227
cd63
-0.046
LOC100005187
0.223
CABZ01021592.1
-0.045
LOC100333185
0.214
gpd1b
-0.041
LOC100535857
0.212
rab34b
-0.039
si:ch1073-268j14.1
0.212
tmem243a
-0.039
nr3c2
0.206
aldob
-0.038
si:ch211-214p13.8
0.206
s100a10b
-0.036
htr2b
0.201
pfn2
-0.036
NC-002333.19
0.198
rplp1
-0.035
homer3a
0.198
pcbd1
-0.034
si:ch211-145c1.1
0.178
rps12
-0.034
CU639412.1
0.165
gstp1
-0.034
mcf2lb
0.165
gstt1a
-0.033
wdr17
0.161
hbbe1.3
-0.033
scmh1
0.159
bco1
-0.033
CT583728.14
0.157
rpl36a
-0.033
LOC100535208
0.154
tmem130
-0.032
kitlgb
0.154
actb2
-0.032
kctd1
0.148
cyb5a
-0.032
serping1
0.147
qdpra
-0.032
mtx3
0.147
csrp2
-0.032
znf831
0.147
si:dkey-56m19.5
-0.031
ppargc1a
0.145
aox5
-0.031
dnah3
0.141
rpl19
-0.031
pip5k1cb
0.141
sprb
-0.031
trim107
0.140
aqp3a
-0.031