Daniocell
prr7 (endoderm)
proline rich 7 (synaptic)
ZFIN
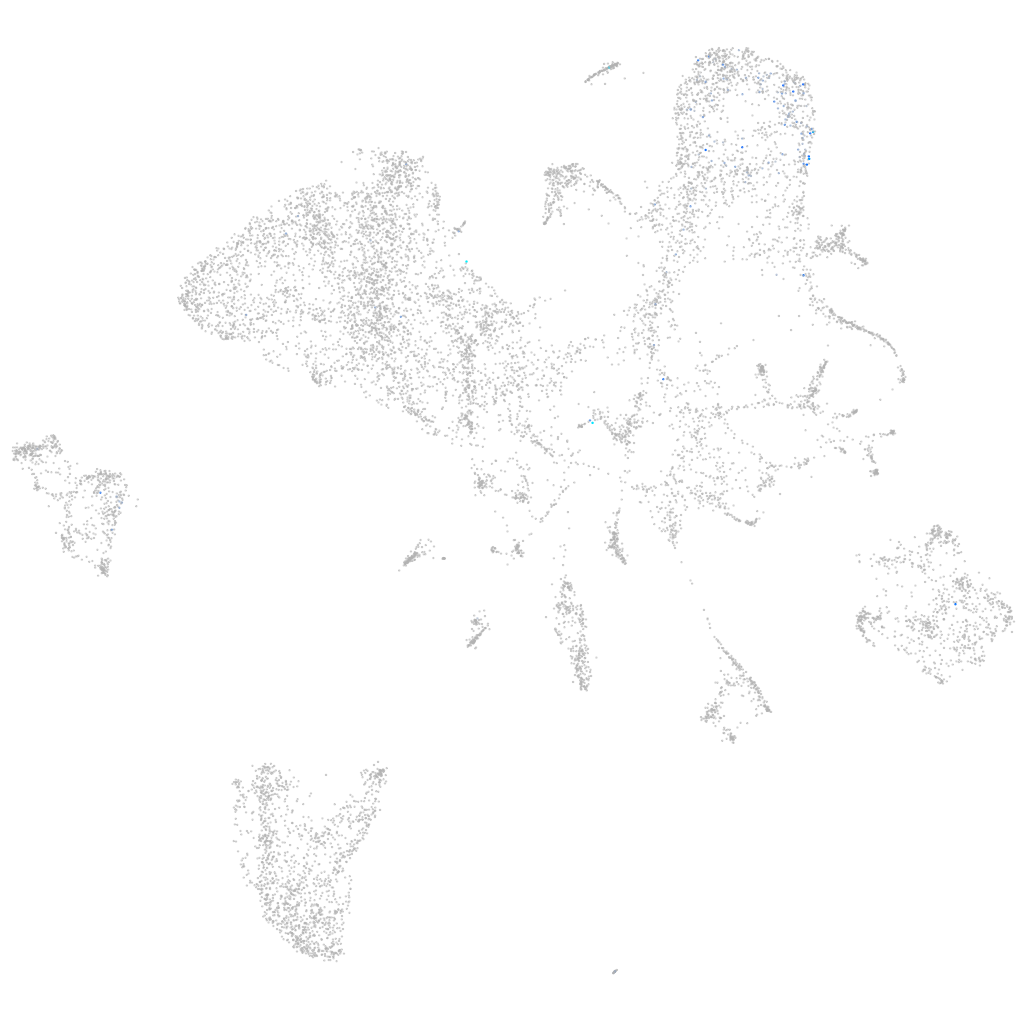
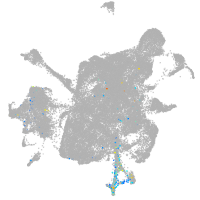
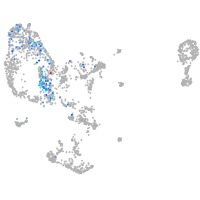
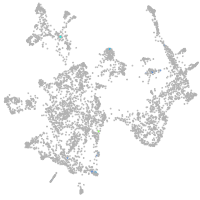
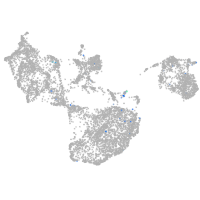
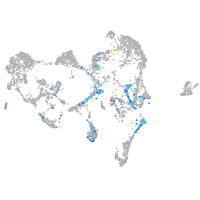
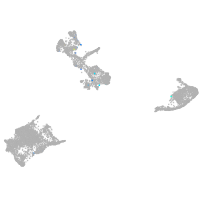
Gene expression UMAP
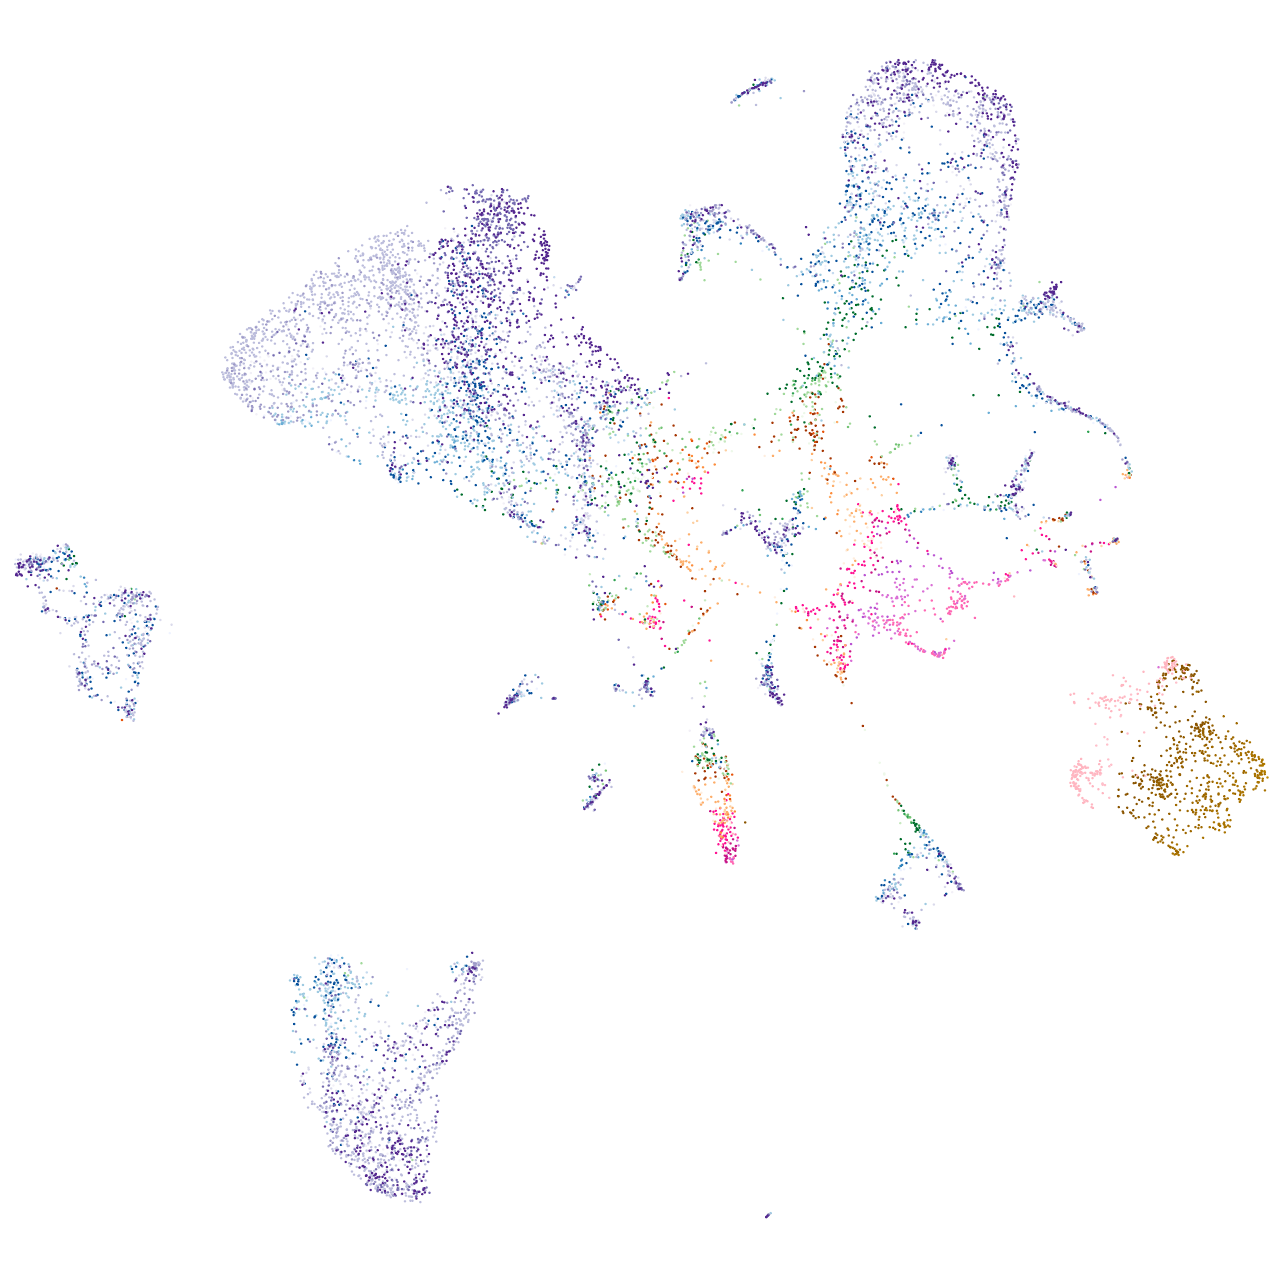
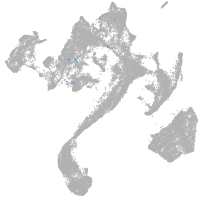
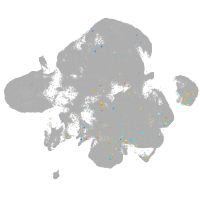
Display:
Expression
Stage
Other cell groups
all cells
blastomeres
PGCs
endoderm
axial mesoderm
muscle
mural cells /
non-skeletal muscle
mesenchyme
hematopoietic /
vasculature
pronephros
neural
spinal cord / glia
eye
taste / olfactory
otic / lateral line
epidermis
periderm
fin
ionocytes / mucous
pigment cells
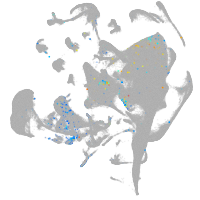
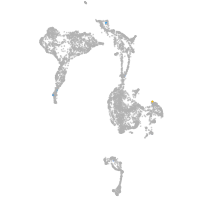
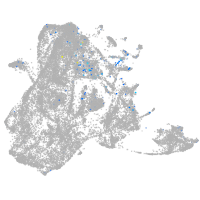
Expression by stage/cluster
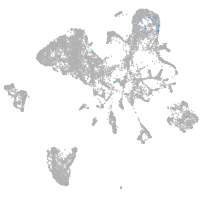
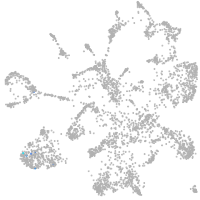
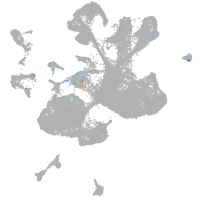
Correlated gene expression
Positive correlation
Negative correlation
Gene
r
Gene
r
si:ch211-225k7.5
0.331
fabp3
-0.062
si:ch73-190f9.4
0.287
aqp12
-0.052
smtna
0.257
bhmt
-0.050
si:dkey-28d5.14
0.254
fxyd1
-0.049
CABZ01034691.1
0.225
tfa
-0.046
LOC103909138
0.203
agxtb
-0.043
si:ch211-214p16.3
0.196
kng1
-0.043
si:ch211-236p5.2
0.192
ndrg2
-0.043
si:dkey-219e21.2
0.183
hao1
-0.043
enpp7.1
0.182
serpina1l
-0.043
si:ch211-112g6.4
0.179
apoc1
-0.042
mep1a.2
0.178
rbp2b
-0.042
LOC103911739
0.178
fgg
-0.042
si:ch73-40a17.3
0.176
zgc:123103
-0.041
si:dkey-61f9.1
0.174
lcn15
-0.041
chs1
0.172
cfh
-0.041
ACOT12
0.169
c8g
-0.041
slc6a19b
0.168
cfhl4
-0.041
slc26a3.2
0.166
serpinc1
-0.041
mep1a.1
0.165
serpinf2b
-0.041
si:dkey-83f18.2
0.164
itih2
-0.040
aoc1
0.162
serpina1
-0.040
si:ch211-220f21.1
0.161
ppdpfb
-0.040
si:ch211-161h7.5
0.160
f2
-0.040
chia.2
0.159
vtnb
-0.039
cd36
0.156
angptl3
-0.039
si:ch211-77g15.32
0.155
wu:fj16a03
-0.039
alpi.2
0.155
urad
-0.038
slc26a6
0.154
fgb
-0.038
ace
0.152
apoa2
-0.038
prr16
0.152
vtna
-0.038
LOC100536156
0.151
dpys
-0.038
pm20d1.1
0.151
c3a.1
-0.038
cpo
0.151
selenop2
-0.038
alox5ap
0.150
tymp
-0.038