Daniocell
pparaa (blastomeres)
peroxisome proliferator-activated receptor alpha a
ZFIN
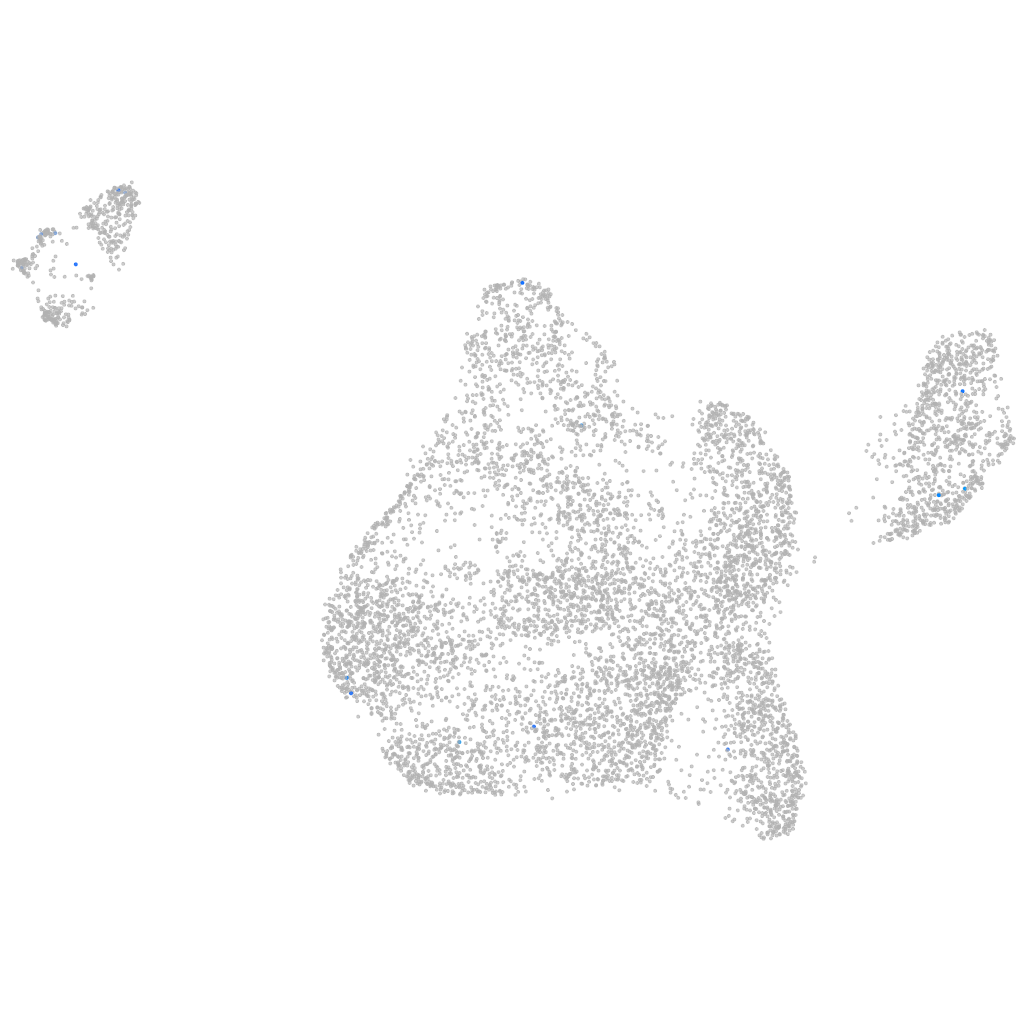
Gene expression UMAP
Display:
Expression
Stage
Other cell groups
all cells
blastomeres
PGCs
endoderm
axial mesoderm
muscle
mural cells /
non-skeletal muscle
mesenchyme
hematopoietic /
vasculature
pronephros
neural
spinal cord / glia
eye
taste / olfactory
otic / lateral line
epidermis
periderm
fin
ionocytes / mucous
pigment cells
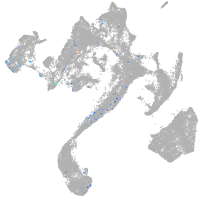
Expression by stage/cluster
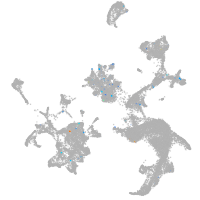
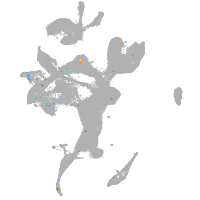
Correlated gene expression
Positive correlation
Negative correlation
Gene
r
Gene
r
BX005083.1
0.369
aldob
-0.040
LOC103911773
0.365
hspb1
-0.040
tmeff2b
0.285
marcksl1b
-0.037
dnaaf3
0.229
CR383676.1
-0.036
LOC110438745
0.216
si:ch73-1a9.3
-0.035
ldlra
0.213
si:ch211-222l21.1
-0.035
stxbp6l
0.205
hmgb2a
-0.034
mir20a
0.186
rhoab
-0.033
LOC110438017
0.177
polr3gla
-0.032
CABZ01079081.1
0.177
si:ch211-152c2.3
-0.032
fgf20b
0.175
NC-002333.4
-0.031
gabra4
0.170
rplp1
-0.031
cd226
0.163
eef1a1l1
-0.030
CU861459.1
0.162
rplp0
-0.029
atp6v0a2a
0.146
stm
-0.029
BX571724.2
0.141
si:ch1073-80i24.3
-0.028
atraid
0.137
med19a
-0.028
zgc:85722
0.136
hnrnpa0b
-0.026
LOC110438288
0.134
anp32e
-0.026
kcnh6a
0.127
si:ch211-15b10.6
-0.025
LOC103911895
0.127
ybx1
-0.025
LOC110438441
0.127
rpsa
-0.025
mctp1b
0.127
utp15
-0.025
tlr21
0.127
rps19
-0.025
wnt10b
0.127
rpl7
-0.024
LOC101885143
0.126
rps2
-0.024
lhx4
0.121
sp5l
-0.024
zgc:195212
0.121
top2a
-0.024
BX279523.3
0.118
hmga1a
-0.023
fam8a1a
0.117
nop53
-0.023
CR848032.1
0.114
ptmab
-0.023
myt1la
0.114
sox3
-0.023
nr0b2a
0.113
mcm6
-0.022
prmt8b
0.113
rpl15
-0.022
CR628327.1
0.112
atp1b1a
-0.022