Daniocell
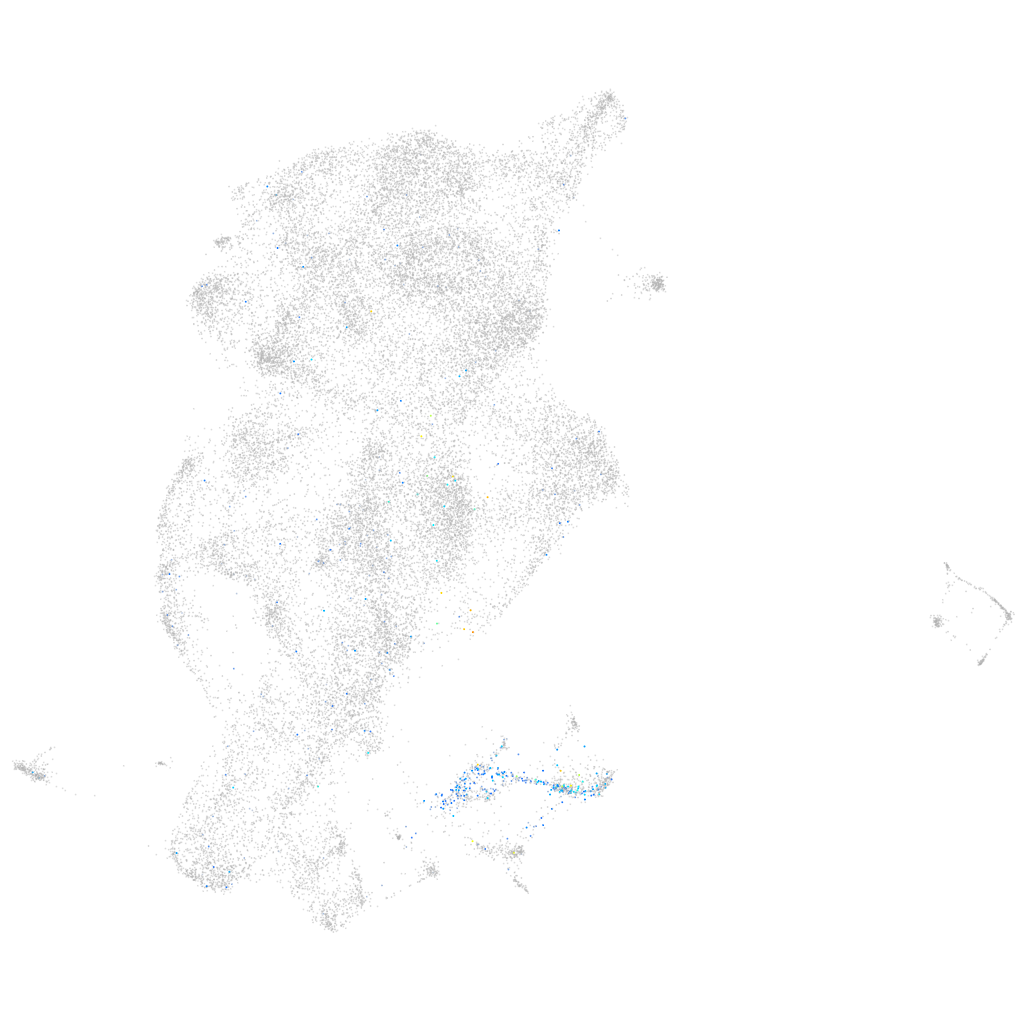
pou3f3b (periderm)
POU class 3 homeobox 3b
ZFIN
Gene expression UMAP
Display:
Expression
Stage
Other cell groups
all cells
blastomeres
PGCs
endoderm
axial mesoderm
muscle
mural cells /
non-skeletal muscle
mesenchyme
hematopoietic /
vasculature
pronephros
neural
spinal cord / glia
eye
taste / olfactory
otic / lateral line
epidermis
periderm
fin
ionocytes / mucous
pigment cells
Expression by stage/cluster
Correlated gene expression
Positive correlation
Negative correlation
Gene
r
Gene
r
nova2
0.290
cfl1l
-0.085
elavl3
0.260
cyt1
-0.080
hmgb3a
0.251
si:ch211-195b11.3
-0.078
rtn1a
0.242
aldob
-0.078
si:ch211-137a8.4
0.238
selenow1
-0.071
tmeff1b
0.229
mid1ip1a
-0.070
marcksl1a
0.227
krt5
-0.069
hmgb1b
0.225
krt4
-0.068
pou3f3a
0.224
dhrs13a.2
-0.067
tuba1c
0.223
eef1da
-0.065
gpm6aa
0.219
si:ch73-52f15.5
-0.065
myt1b
0.218
scel
-0.064
si:ch211-222l21.1
0.215
pycard
-0.064
tmsb
0.214
glo1
-0.060
mdkb
0.210
zgc:193505
-0.058
stmn1b
0.209
mgst1.2
-0.058
sox11b
0.201
selenow2b
-0.058
tubb5
0.201
krt17
-0.056
si:dkey-56m19.5
0.199
si:dkeyp-51b9.3
-0.056
XLOC-003692
0.199
ckap4
-0.055
dla
0.197
epcam
-0.055
zgc:165461
0.195
tmem176l.4
-0.055
dpysl2b
0.195
wu:fb18f06
-0.054
pou3f1
0.194
cldnb
-0.054
gpm6ab
0.193
zgc:162730
-0.054
zc4h2
0.192
si:ch211-207n23.2
-0.053
epb41a
0.192
lgals3b
-0.053
si:ch73-30b17.2
0.190
pfn1
-0.053
dlb
0.189
slc38a5b
-0.052
XLOC-003690
0.189
tdh
-0.052
tuba1a
0.189
fuca1.1
-0.052
st8sia2
0.187
si:dkey-247k7.2
-0.052
mbd3b
0.187
anxa1a
-0.051
LOC100537384
0.186
si:ch211-105c13.3
-0.051
cd99l2
0.186
prr13
-0.051