Daniocell
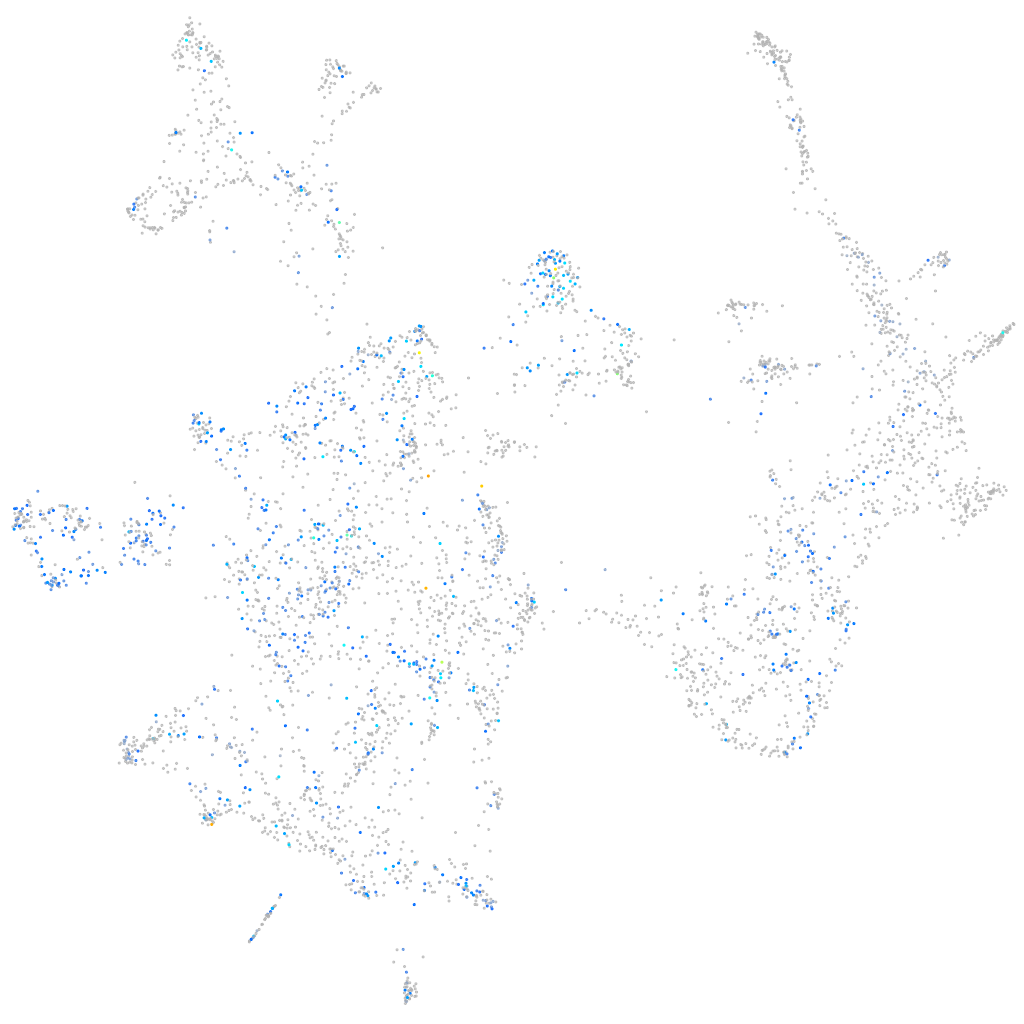
plxna3 (otic / lateral line)
plexin A3
ZFIN
Gene expression UMAP
Display:
Expression
Stage
Other cell groups
all cells
blastomeres
PGCs
endoderm
axial mesoderm
muscle
mural cells /
non-skeletal muscle
mesenchyme
hematopoietic /
vasculature
pronephros
neural
spinal cord / glia
eye
taste / olfactory
otic / lateral line
epidermis
periderm
fin
ionocytes / mucous
pigment cells
Expression by stage/cluster
Correlated gene expression
Positive correlation
Negative correlation
Gene
r
Gene
r
zbtb16a
0.202
pvalb8
-0.137
zgc:194210
0.172
nqo1
-0.134
nova2
0.170
si:ch211-153b23.5
-0.131
si:ch211-222l21.1
0.169
capgb
-0.127
oc90
0.162
nfe2l2a
-0.127
cdk5r1b
0.160
txn
-0.125
tmeff1b
0.157
negaly6
-0.123
cldna
0.148
zgc:158343
-0.119
sox11a
0.147
si:ch211-103f14.3
-0.118
marcksb
0.145
krt1-c5
-0.117
srsf5a
0.145
si:dkey-205h13.2
-0.116
CABZ01075068.1
0.144
calml4a
-0.115
khdrbs1a
0.143
dnajc5b
-0.112
zfp36l1a
0.143
gpx1b
-0.112
hnrnpaba
0.140
wu:fb18f06
-0.111
marcksl1a
0.139
gpx2
-0.111
sox10
0.139
LOC100536887
-0.110
stmn2a
0.134
otofb
-0.110
acbd7
0.134
wu:fj16a03
-0.109
si:dkey-276j7.1
0.134
tmem176l.4
-0.107
sox6
0.133
krt15
-0.107
efhd1
0.133
grtp1a
-0.105
si:ch73-46j18.5
0.133
padi2
-0.105
mbd3b
0.132
LOC799574
-0.105
nat8l
0.132
nkx3.2
-0.104
hnrnpa0b
0.131
si:dkey-103g5.3
-0.103
tubb5
0.131
cd164l2
-0.103
stxbp1a
0.130
anxa4
-0.102
h3f3d
0.129
osbpl1a
-0.102
ybx1
0.128
si:dkey-16p21.8
-0.102
LOC103909988
0.128
s100t
-0.101
XLOC-021867
0.128
si:dkey-11c5.11
-0.101
apex1
0.127
calm1b
-0.101
sumo2b
0.127
sod1
-0.100
igf2bp1
0.126
soul2
-0.099