Daniocell
plppr3a (taste / olfactory)
phospholipid phosphatase related 3a
ZFIN
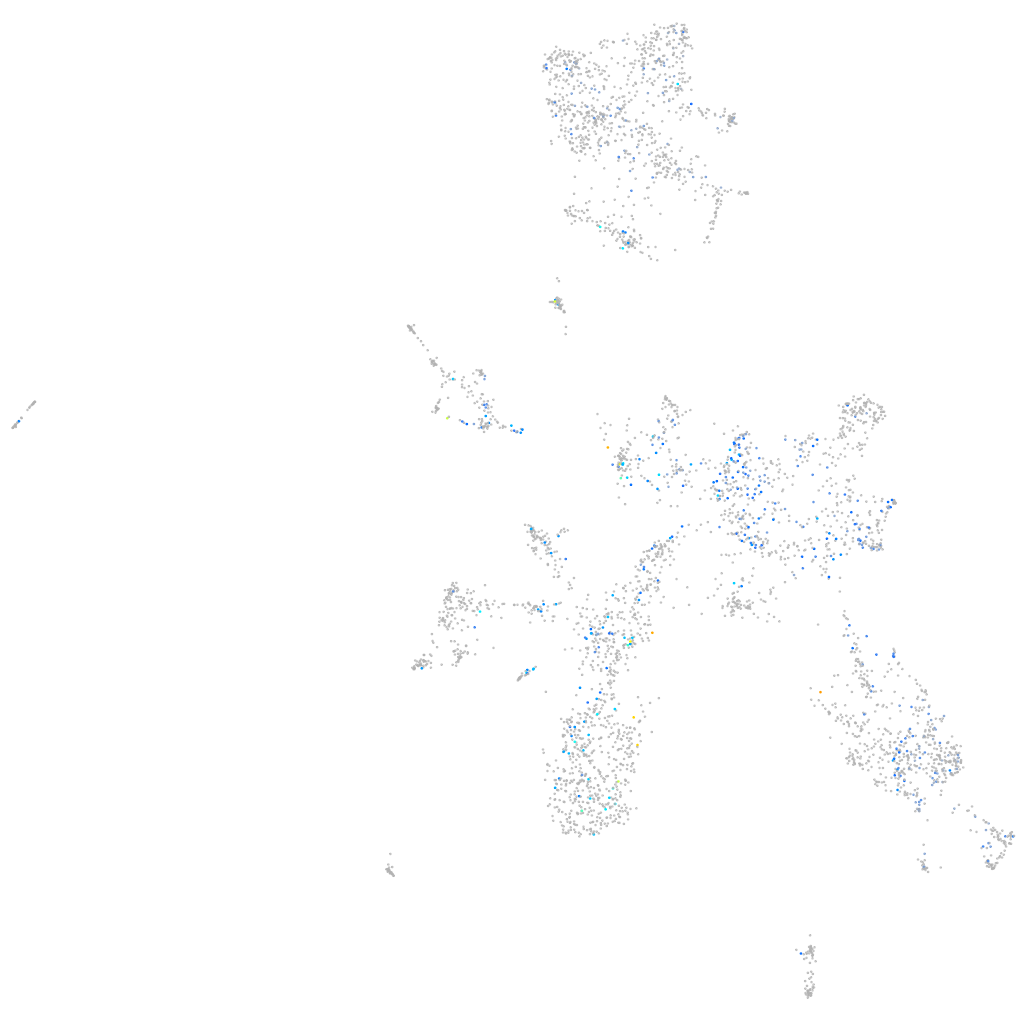
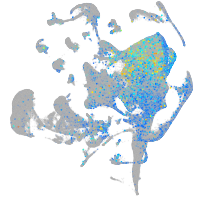
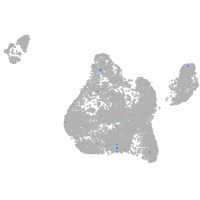
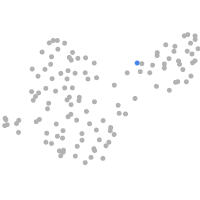
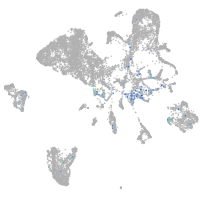
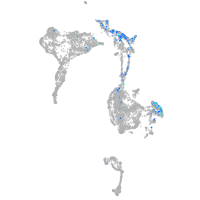
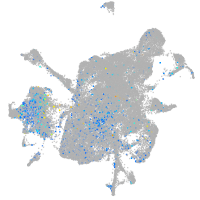
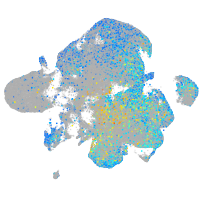
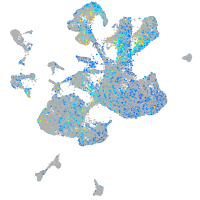
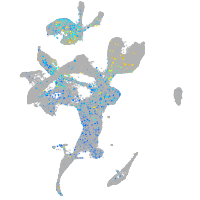
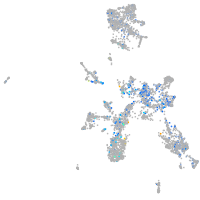
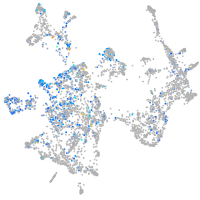
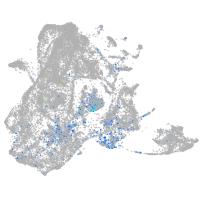
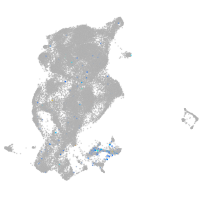
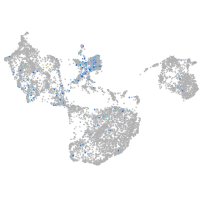
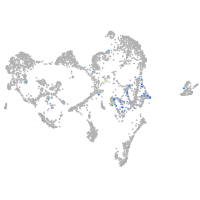
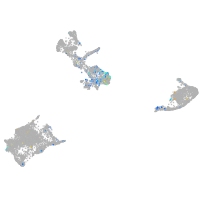
Gene expression UMAP
Display:
Expression
Stage
Other cell groups
all cells
blastomeres
PGCs
endoderm
axial mesoderm
muscle
mural cells /
non-skeletal muscle
mesenchyme
hematopoietic /
vasculature
pronephros
neural
spinal cord / glia
eye
taste / olfactory
otic / lateral line
epidermis
periderm
fin
ionocytes / mucous
pigment cells
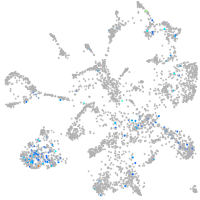
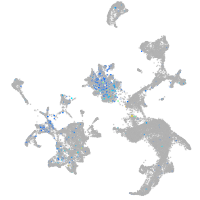
Expression by stage/cluster
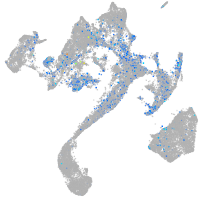
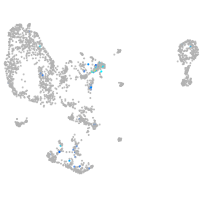
Correlated gene expression
Positive correlation
Negative correlation
Gene
r
Gene
r
XLOC-031679
0.171
tmsb1
-0.093
LOC110438179
0.153
calb2a
-0.091
si:ch211-288g17.3
0.147
wu:fb18f06
-0.090
si:ch1073-159d7.10.1
0.138
tprg1
-0.090
dla
0.133
ier2a
-0.088
si:dkey-26i24.1
0.130
prr15la
-0.088
tmeff1b
0.130
krt91
-0.086
tubb5
0.129
ier2b
-0.085
her4.2
0.129
rpz5
-0.085
hnrnpaba
0.128
anxa4
-0.085
si:dkey-56m19.5
0.128
itm2bb
-0.084
CU467822.1
0.126
zgc:153911
-0.082
her15.1
0.125
s100v2
-0.081
CR931802.2
0.124
pfn1
-0.081
elavl3
0.123
si:ch73-234b20.5
-0.080
sox11b
0.122
hopx
-0.080
hnrnpa0b
0.121
egr2a
-0.079
fezf1
0.120
aqp3a
-0.079
XLOC-015433
0.120
nr4a1
-0.077
uncx
0.119
si:dkey-87o1.2
-0.077
tp53inp2
0.117
klf3
-0.077
her4.4
0.116
capgb
-0.077
hmgn2
0.115
cxcl14
-0.076
neurod4
0.115
gstp1
-0.076
LOC101886973
0.115
zgc:165423
-0.076
hmgb1b
0.115
grtp1a
-0.076
XLOC-011609
0.113
bik
-0.076
h3f3a
0.112
si:ch211-79k12.1
-0.075
LOC108191351
0.112
zgc:92380
-0.075
h2afva
0.111
kcnk17
-0.075
inavaa
0.110
scinlb
-0.074
BX119963.4
0.110
foxq1a
-0.074
lhx9
0.110
s100a10b
-0.074
rbm8a
0.110
itpkb
-0.074
CT025771.1
0.110
txn
-0.074