Daniocell
pla2g1b (periderm)
"phospholipase A2, group IB (pancreas)"
ZFIN
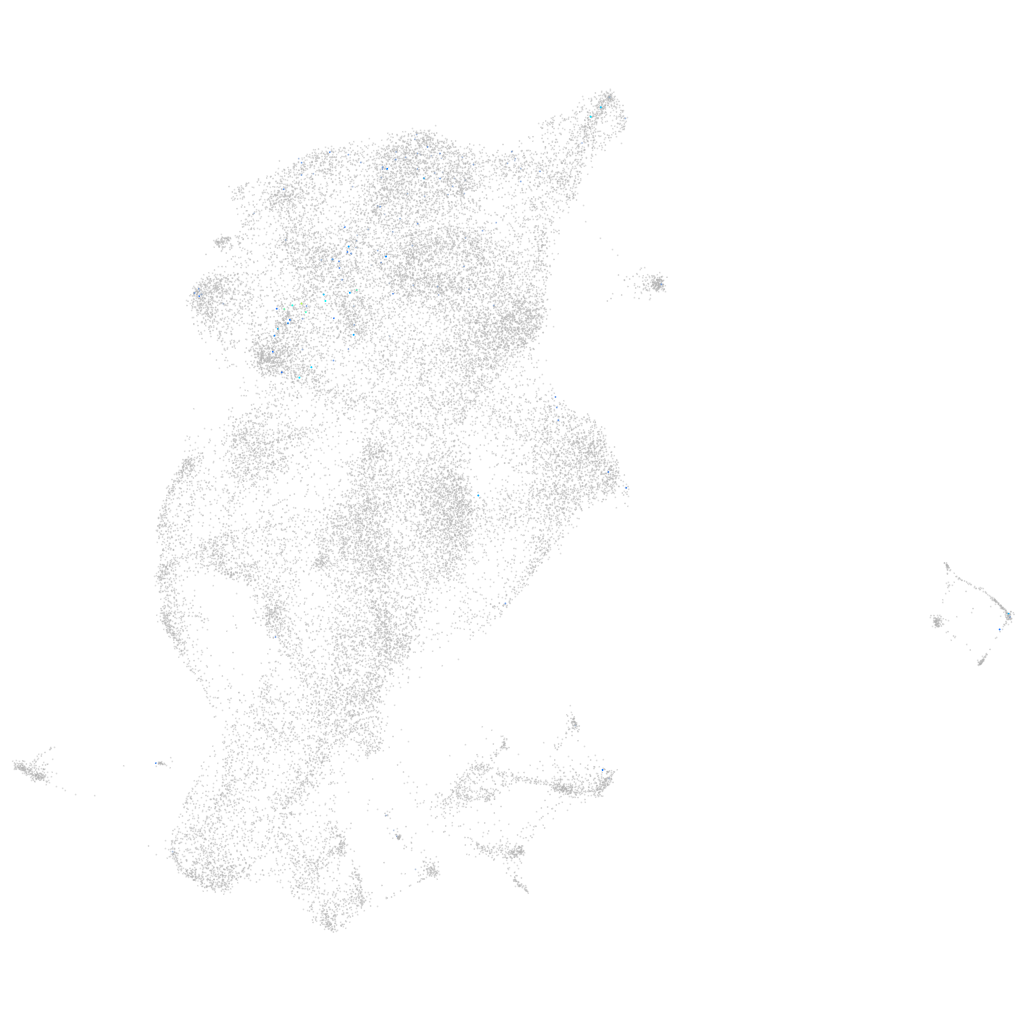
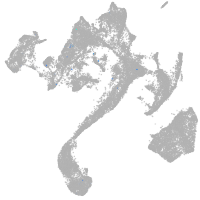
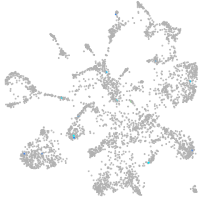
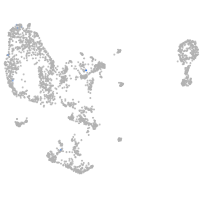
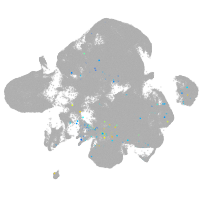
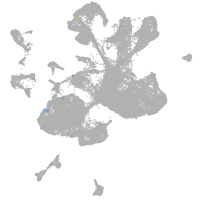
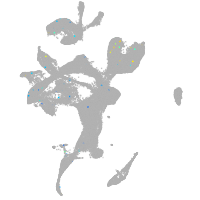
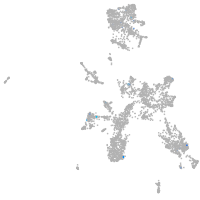
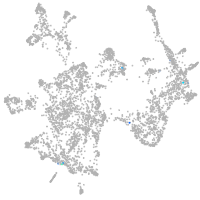
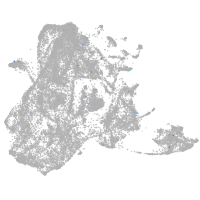
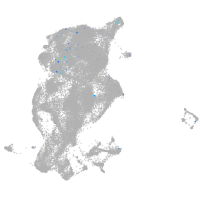
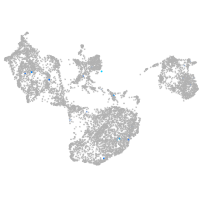
Gene expression UMAP
Display:
Expression
Stage
Other cell groups
all cells
blastomeres
PGCs
endoderm
axial mesoderm
muscle
mural cells /
non-skeletal muscle
mesenchyme
hematopoietic /
vasculature
pronephros
neural
spinal cord / glia
eye
taste / olfactory
otic / lateral line
epidermis
periderm
fin
ionocytes / mucous
pigment cells
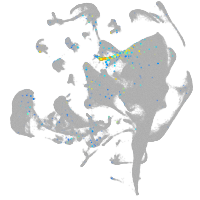
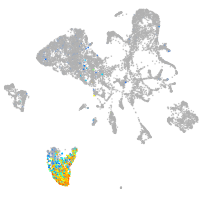
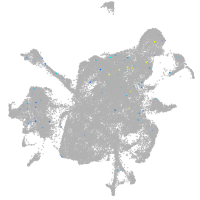
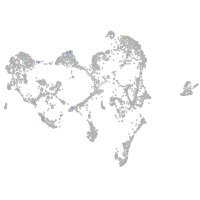
Expression by stage/cluster
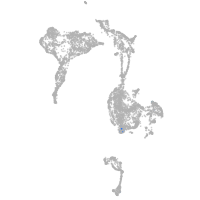
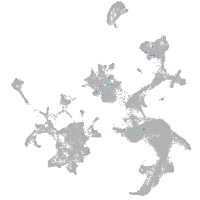
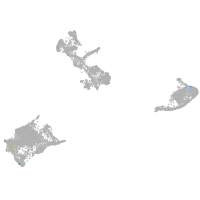
Correlated gene expression
Positive correlation
Negative correlation
Gene
r
Gene
r
si:ch73-380l3.4
0.229
cst14b.1
-0.042
si:ch73-156l6.2
0.182
myl12.1
-0.042
F7 (1 of many)
0.176
gstp1
-0.040
LOC101883755
0.153
wu:fb18f06
-0.040
CR847939.1
0.144
anxa1c
-0.039
cnbd1
0.131
cyt1l
-0.038
ppp1r27b
0.129
agr1
-0.037
XLOC-017135
0.113
tmsb1
-0.037
BX000696.2
0.110
tmsb4x
-0.036
BX469885.1
0.108
oaz1b
-0.036
cxcl11.7
0.107
gsnb
-0.036
BX469902.1
0.106
aep1
-0.035
si:dkey-83m22.7
0.105
mgst2
-0.034
si:dkey-283b1.6
0.104
ywhaz
-0.033
faah2b
0.100
krt4
-0.032
LOC103911496
0.098
zgc:153284
-0.032
kcnj3b
0.098
si:ch211-195b11.3
-0.032
si:dkey-76b14.2
0.095
si:ch73-1a9.3
-0.032
XLOC-029568
0.094
zgc:112964
-0.031
ela2l
0.094
anxa1b
-0.031
CR855996.2
0.093
ywhaba
-0.031
phf19
0.093
cfl1l
-0.031
slc22a4
0.089
zgc:193505
-0.030
LOC101884560
0.088
dad1
-0.030
ceacam1
0.088
zgc:153867
-0.030
si:dkey-219c10.4
0.086
si:dkey-74k8.3
-0.030
nrbf2a
0.084
ANXA1 (1 of many)
-0.029
LRRTM4
0.084
zgc:174938
-0.029
glsl
0.082
kdelr2b
-0.029
CABZ01065425.1
0.081
arhgdia
-0.029
lrfn5b
0.080
zgc:163030
-0.029
rab3db
0.079
icn
-0.029
cyp19a1a
0.078
ssr3
-0.029
kif26bb
0.077
cirbpb
-0.028
prss59.2
0.077
zgc:175088
-0.028