Daniocell
pigb (fin)
"phosphatidylinositol glycan anchor biosynthesis, class B"
ZFIN
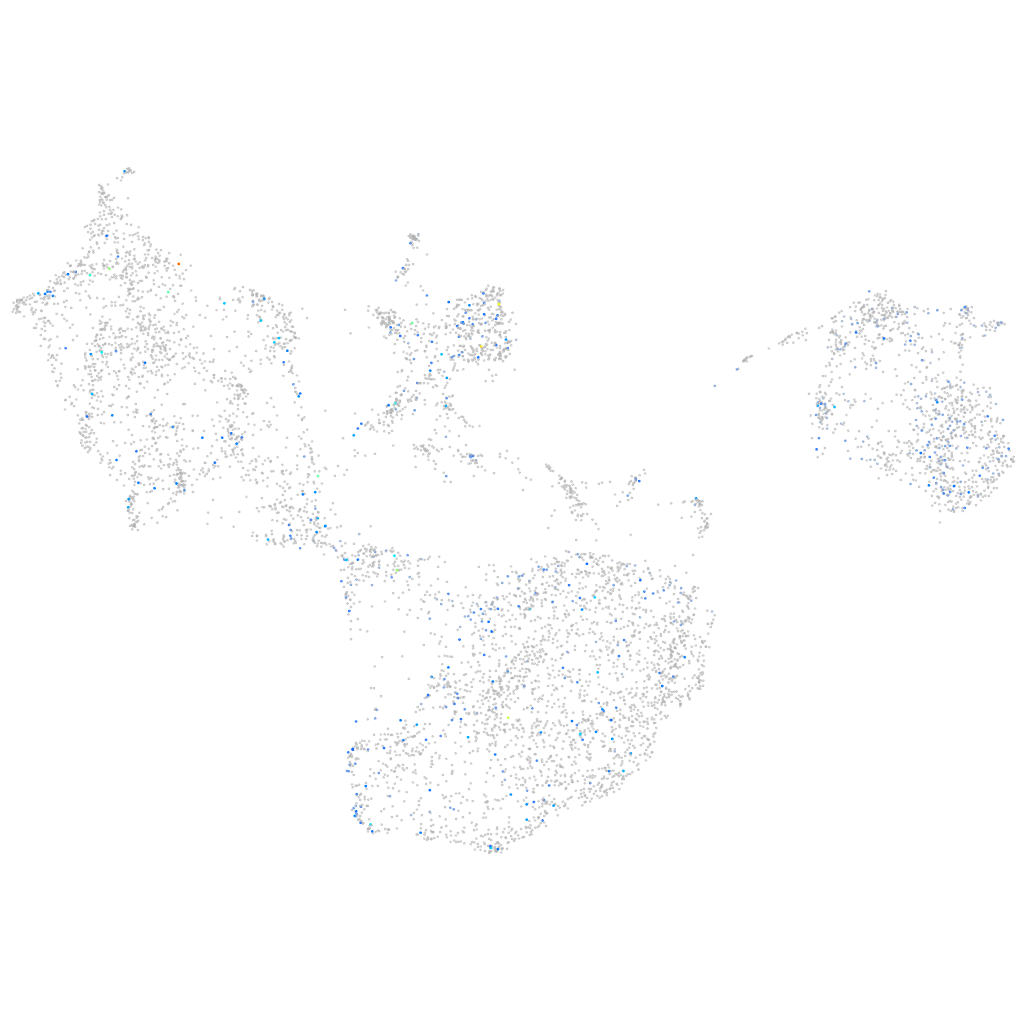
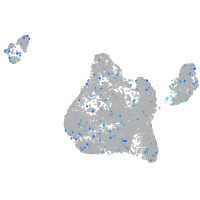
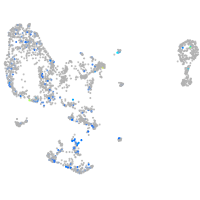
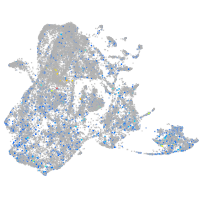
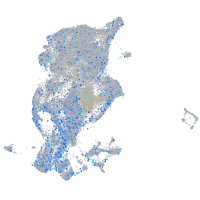
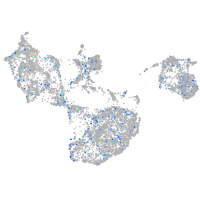
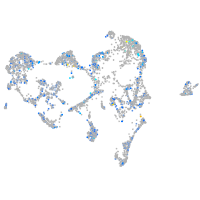
Gene expression UMAP
Display:
Expression
Stage
Other cell groups
all cells
blastomeres
PGCs
endoderm
axial mesoderm
muscle
mural cells /
non-skeletal muscle
mesenchyme
hematopoietic /
vasculature
pronephros
neural
spinal cord / glia
eye
taste / olfactory
otic / lateral line
epidermis
periderm
fin
ionocytes / mucous
pigment cells
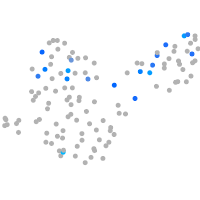
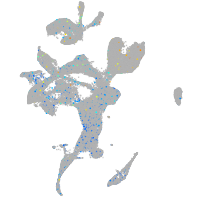
Expression by stage/cluster
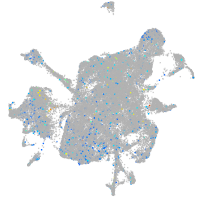
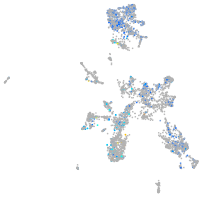
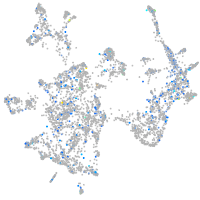
Correlated gene expression
Positive correlation
Negative correlation
Gene
r
Gene
r
LOC101885014
0.175
slc16a10
-0.043
si:dkey-102g19.3
0.162
zgc:158463
-0.041
ccdc17
0.148
pvalb2
-0.037
LOC110440123
0.133
rps18
-0.036
XLOC-033031
0.127
pax9
-0.036
CR626902.1
0.125
actc1b
-0.036
SLCO3A1 (1 of many)
0.125
gstz1
-0.036
cx32.3
0.124
bhmt
-0.035
jak3
0.120
col5a1
-0.034
LOC103911261
0.120
c1qtnf5
-0.034
il1rapl2
0.117
qdpra
-0.033
si:dkey-26h11.2
0.112
si:ch211-14k19.8
-0.033
LOC100331497
0.111
ctrb1
-0.032
plek
0.106
mylz3
-0.031
XLOC-041834
0.105
lrp1aa
-0.031
LOC101885256
0.105
fap
-0.031
LOC100536156
0.104
pvalb1
-0.031
cacng4b
0.100
fbln1
-0.029
LOC103910374
0.100
LOC110439372
-0.029
syngap1b
0.097
pah
-0.029
BX323031.1
0.092
si:ch73-217n20.1
-0.028
CR627496.1
0.092
hgd
-0.028
XLOC-028443
0.092
vstm4a
-0.028
dlgap2a
0.090
ccl25b
-0.028
crygmx
0.089
ckmb
-0.028
stard15
0.089
gpc1a
-0.028
asic4a
0.088
itgb3b
-0.028
znf1138
0.088
col1a1a
-0.028
tespa1
0.088
and2
-0.027
LOC101885703
0.088
hbbe1.2
-0.027
LOC103909293
0.085
lpin1
-0.027
tmprss3b
0.085
col11a1b
-0.026
si:ch211-203b8.6
0.082
pdgfrl
-0.026
anxa11b
0.082
mxra8b
-0.026
sap18
0.082
rflnb
-0.026