Daniocell
phospho1 (epidermis)
phosphoethanolamine/phosphocholine phosphatase 1
ZFIN
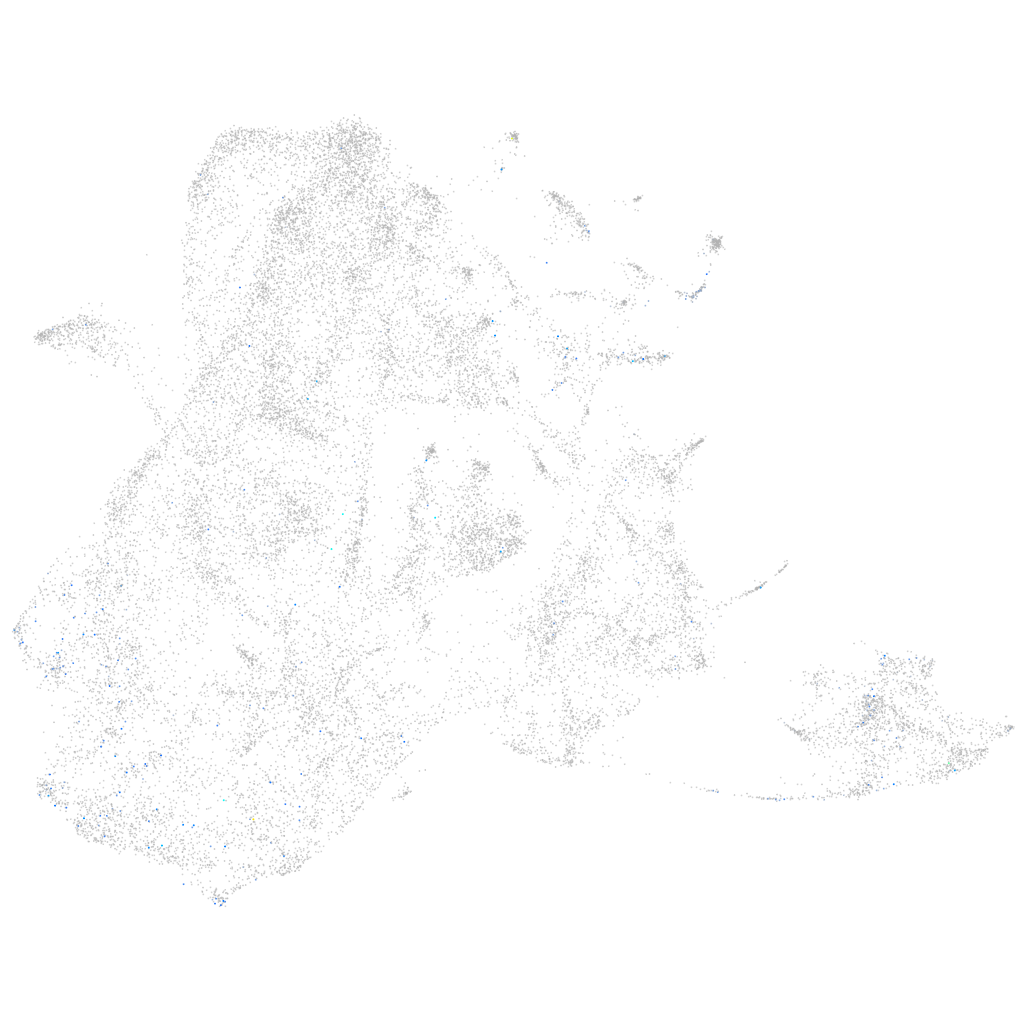
Gene expression UMAP
Display:
Expression
Stage
Other cell groups
all cells
blastomeres
PGCs
endoderm
axial mesoderm
muscle
mural cells /
non-skeletal muscle
mesenchyme
hematopoietic /
vasculature
pronephros
neural
spinal cord / glia
eye
taste / olfactory
otic / lateral line
epidermis
periderm
fin
ionocytes / mucous
pigment cells
Expression by stage/cluster
Correlated gene expression
Positive correlation
Negative correlation
Gene
r
Gene
r
btr05
0.167
krt91
-0.057
sgms2a
0.167
gapdhs
-0.055
panx3
0.165
col1a2
-0.053
ifitm5
0.140
col1a1b
-0.053
entpd5a
0.138
cxl34b.11
-0.049
il17a/f2
0.130
rbp4
-0.049
cd81b
0.130
krtt1c19e
-0.049
bgna
0.127
sparc
-0.048
si:ch211-106n13.3
0.125
zgc:136930
-0.047
si:dkey-267n13.1
0.117
col14a1b
-0.047
GPR151
0.110
si:dkey-33c14.3
-0.047
fam129ab
0.106
col11a1a
-0.047
col10a1a
0.106
col1a1a
-0.046
CABZ01087025.3
0.104
tmsb4x
-0.045
tmem119a
0.102
cotl1
-0.045
rp1l1b
0.100
lgals1l1
-0.045
si:dkey-45h7.1
0.100
krt5
-0.044
edil3b
0.097
si:dkey-183i3.5
-0.043
cacng5b
0.097
kera
-0.043
LOC101882287
0.089
col4a5
-0.043
CABZ01063203.1
0.088
epgn
-0.043
LOC110438297
0.088
aqp3a
-0.042
HTRA2 (1 of many).11
0.087
cldn1
-0.041
myo15ab
0.084
col17a1a
-0.041
trpc4a
0.081
aep1
-0.040
atp1b2b
0.080
col2a1b
-0.040
si:ch211-121a2.4
0.076
rplp2
-0.039
enam
0.076
rpl38
-0.038
myhc4
0.076
si:ch211-39i22.1
-0.038
CT573316.3
0.076
postnb
-0.037
RBP1 (1 of many)
0.074
cdo1
-0.037
LOC110438065
0.074
itgb1b.2
-0.037
bmp2a
0.073
col4a6
-0.036
si:dkey-82i20.1
0.072
itgb4
-0.036
LOC100331665
0.071
igfbp7
-0.035