Daniocell
pgap1 (pigment cells)
post-GPI attachment to proteins inositol deacylase 1
ZFIN
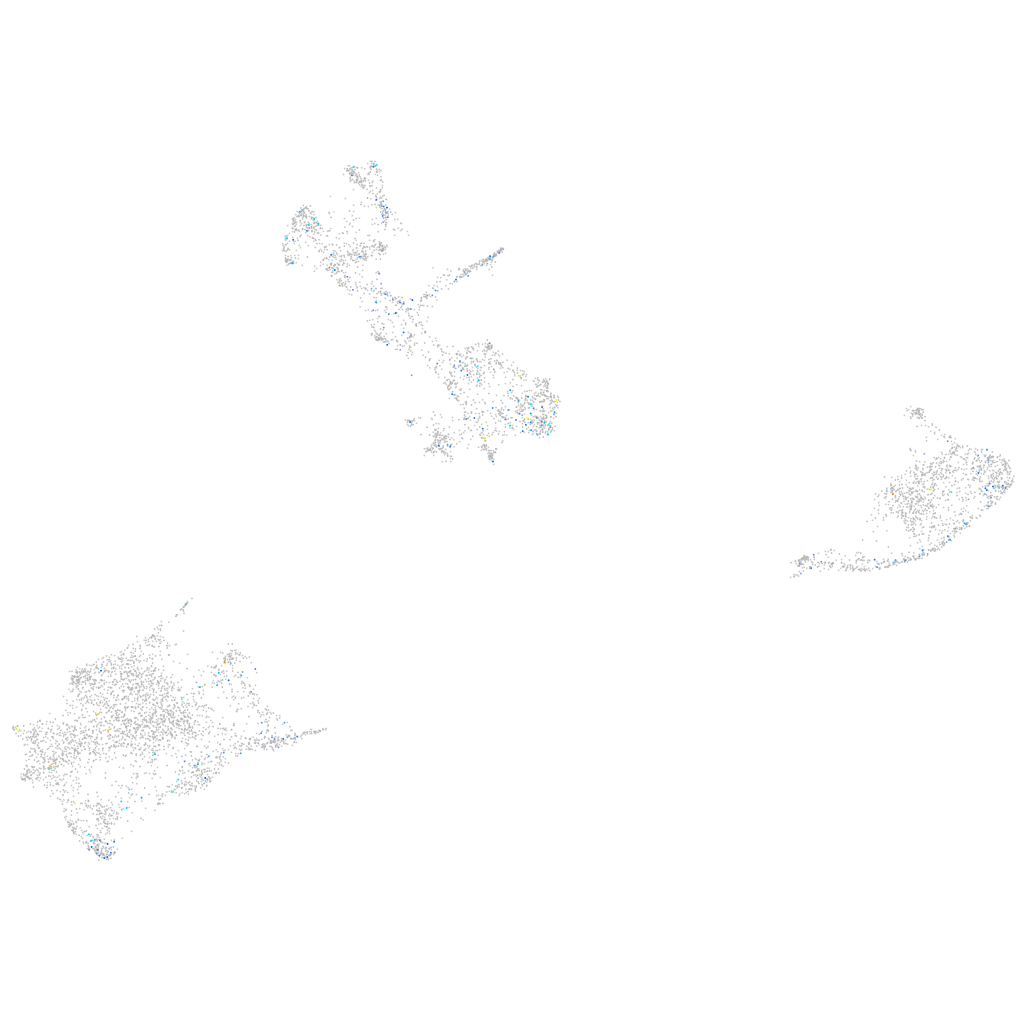
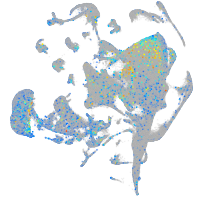
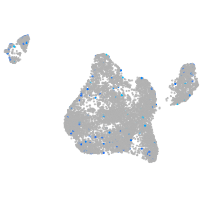
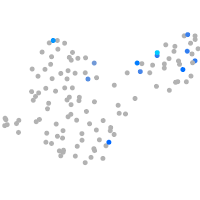
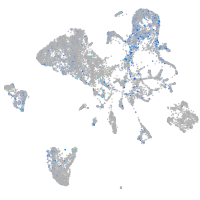
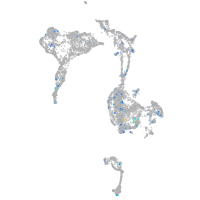
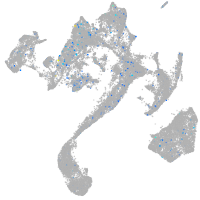
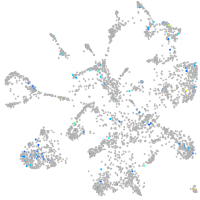
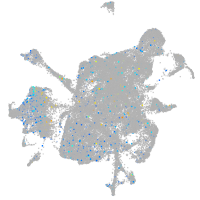
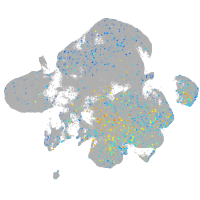
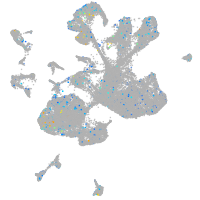
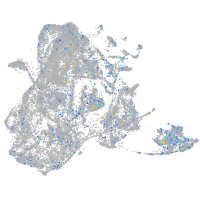
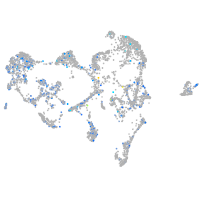
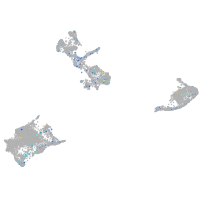
Gene expression UMAP
Display:
Expression
Stage
Other cell groups
all cells
blastomeres
PGCs
endoderm
axial mesoderm
muscle
mural cells /
non-skeletal muscle
mesenchyme
hematopoietic /
vasculature
pronephros
neural
spinal cord / glia
eye
taste / olfactory
otic / lateral line
epidermis
periderm
fin
ionocytes / mucous
pigment cells
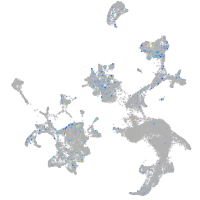
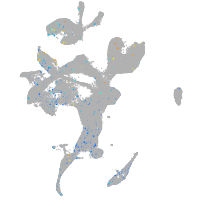
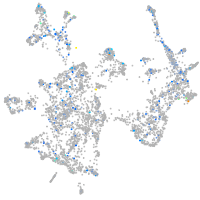
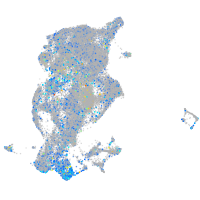
Expression by stage/cluster
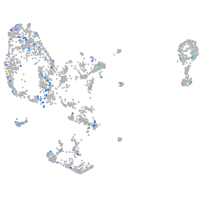
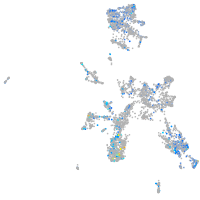
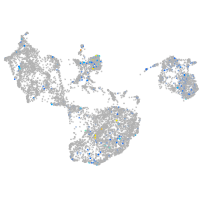
Correlated gene expression
Positive correlation
Negative correlation
Gene
r
Gene
r
otop2
0.164
prdx1
-0.044
kcnk13a
0.149
gch2
-0.039
XLOC-037556
0.140
gstp1
-0.039
si:dkeyp-80c12.5
0.137
si:dkey-151g10.6
-0.037
LOC101884676
0.136
cyb5a
-0.035
XLOC-015260
0.132
pts
-0.034
grhl2a
0.131
akr1b1
-0.034
lrfn4b
0.130
CABZ01021592.1
-0.033
si:ch211-14a17.6
0.129
txn
-0.033
hist1h4l.2
0.127
rps23
-0.032
si:dkey-47k20.5
0.126
rps2
-0.031
grid2
0.126
zgc:153031
-0.030
dlg4b
0.124
rplp0
-0.030
LOC108184019
0.120
nme2b.2
-0.030
CABZ01072157.1
0.118
rbp4l
-0.029
XLOC-029661
0.115
rpl36a
-0.029
CABZ01109604.1
0.114
rplp2l
-0.029
XLOC-044035
0.114
paics
-0.029
CR854907.1
0.112
acta1b
-0.028
zgc:112965
0.111
rps12
-0.027
si:ch211-257p13.3
0.111
hbae3
-0.027
LOC101885478
0.111
myhz1.1
-0.027
si:dkey-6d5.1
0.110
rps14
-0.027
kiaa1958
0.109
hbbe1.2
-0.026
asb2b
0.109
hbbe3
-0.026
cytip
0.109
pcbd1
-0.026
glrba
0.108
si:dkey-251i10.2
-0.025
RF00056
0.107
tnni2a.4
-0.025
zfpm2b
0.107
rpsa
-0.024
LOC101886439
0.107
qdpra
-0.024
LOC110439829
0.106
flot1b
-0.024
zmat4a
0.106
gpd1b
-0.023
CABZ01080098.1
0.106
tnnt3b
-0.023
taar18i
0.106
tnnt3a
-0.023
CR352243.2
0.105
slc25a4
-0.023