Daniocell
pargl (muscle)
"poly (ADP-ribose) glycohydrolase, like"
ZFIN
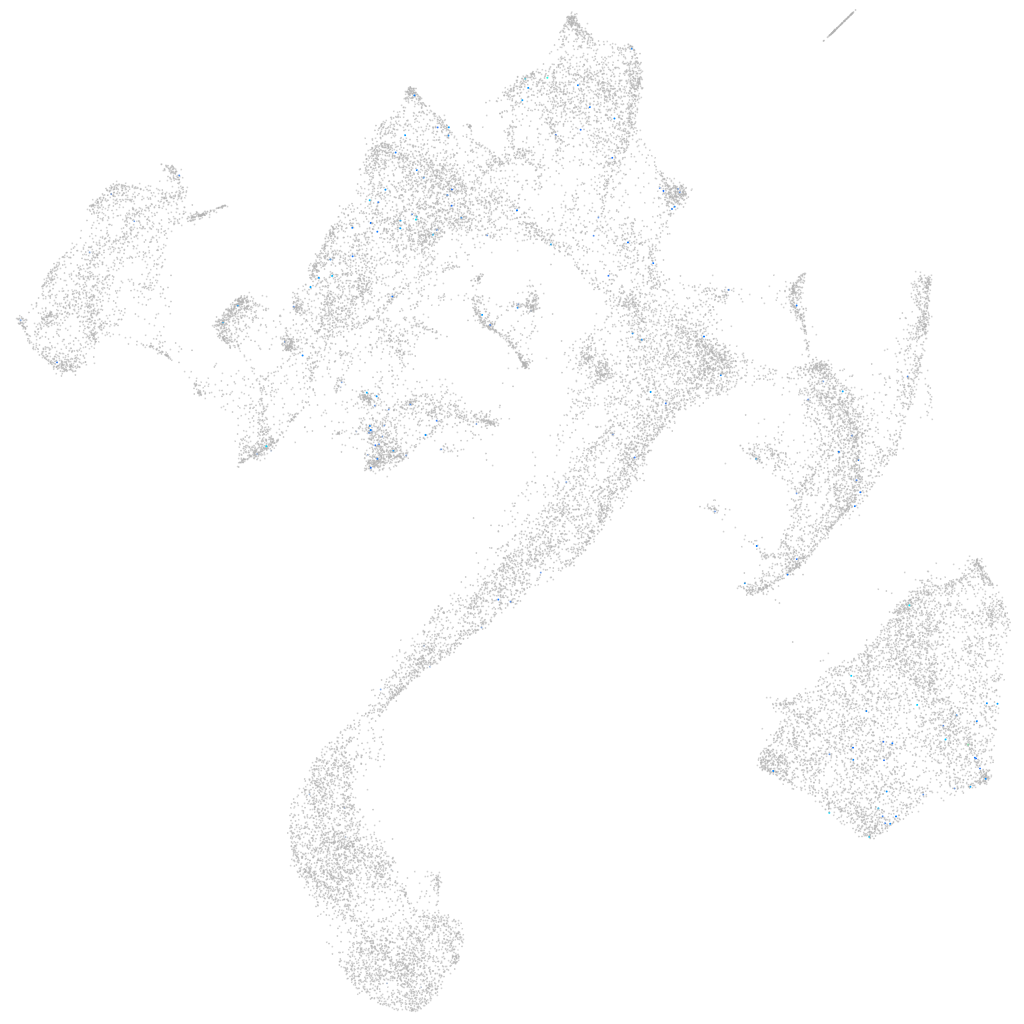
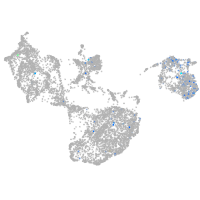
Gene expression UMAP
Display:
Expression
Stage
Other cell groups
all cells
blastomeres
PGCs
endoderm
axial mesoderm
muscle
mural cells /
non-skeletal muscle
mesenchyme
hematopoietic /
vasculature
pronephros
neural
spinal cord / glia
eye
taste / olfactory
otic / lateral line
epidermis
periderm
fin
ionocytes / mucous
pigment cells
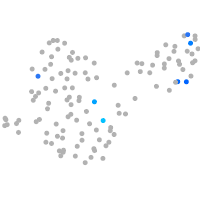
Expression by stage/cluster
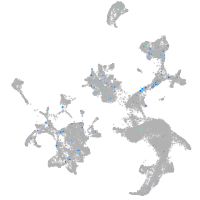
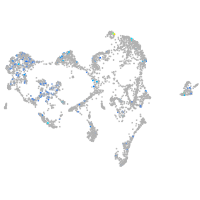
Correlated gene expression
Positive correlation
Negative correlation
Gene
r
Gene
r
si:ch211-112g6.4
0.122
ttn.1
-0.035
LOC100329579
0.117
mybphb
-0.033
BX005108.2
0.111
tpma
-0.033
BX640547.2
0.100
ttn.2
-0.032
th
0.100
aldoab
-0.032
znf979
0.086
actc1b
-0.032
SBSPON
0.084
tmem38a
-0.031
LOC110439630
0.081
cox7a2a
-0.031
adcy3b
0.079
ckmb
-0.030
LOC103908985
0.077
atp2a1
-0.030
si:ch211-254c8.3
0.077
hsp90aa1.1
-0.030
BX005154.1
0.076
ak1
-0.029
LOC799983
0.073
neb
-0.029
LOC101884789
0.073
ldb3a
-0.029
cyp8b2
0.071
CABZ01072309.1
-0.028
LOC101884231
0.066
si:ch73-367p23.2
-0.028
AL953893.1
0.066
CABZ01078594.1
-0.028
ptprbl
0.066
tnnc2
-0.028
znf1070
0.061
smyd1a
-0.028
nitr1k
0.060
acta1b
-0.028
pgfb
0.059
gapdh
-0.028
si:dkey-119m7.4
0.059
actc1a
-0.028
LOC108183641
0.058
actn3a
-0.028
syt1b
0.058
tnnt3a
-0.028
vtcn1
0.057
atp5pd
-0.028
LOC110438494
0.056
ckma
-0.028
CR450686.1
0.056
ank1a
-0.027
tdrd7b
0.055
nme2b.2
-0.027
si:rp71-45g20.4
0.055
atp5mc3b
-0.027
TMEM196
0.055
actn3b
-0.027
cyp11a1
0.054
hacd1
-0.027
irf1a
0.053
tmod4
-0.027
pnck
0.053
XLOC-001975
-0.027
tmem232
0.052
desma
-0.026
si:ch211-264e16.2
0.051
atp5l
-0.026