Daniocell
pan2 (taste / olfactory)
poly(A) specific ribonuclease subunit PAN2
ZFIN
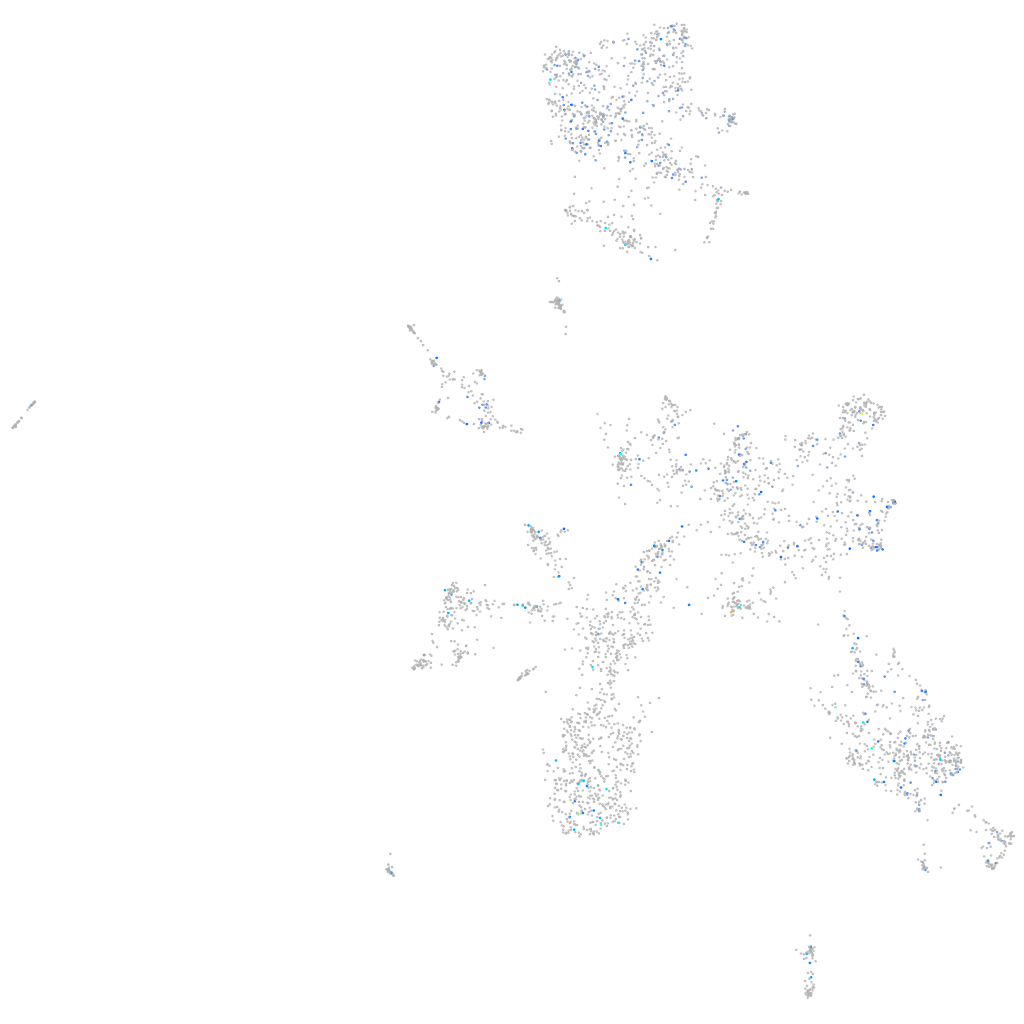
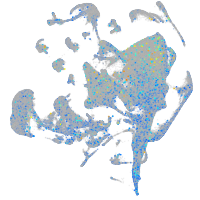
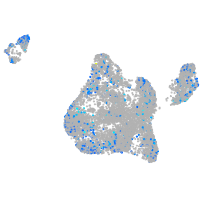
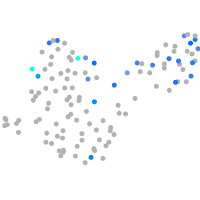
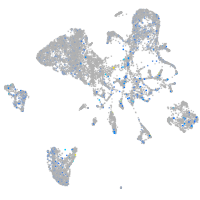
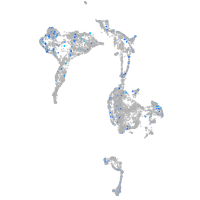
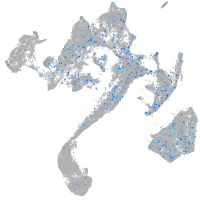
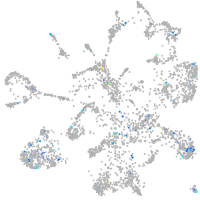
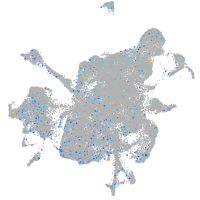
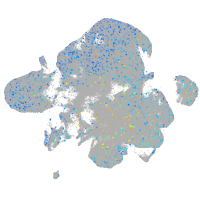
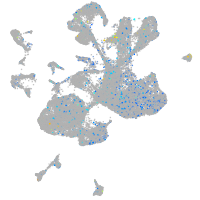
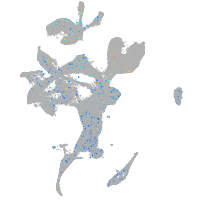
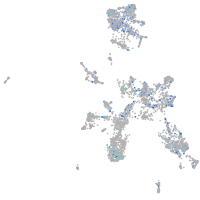
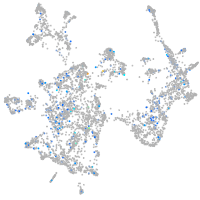
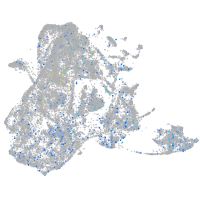
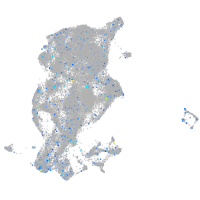
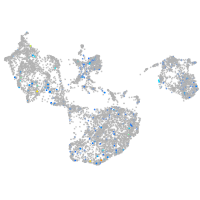
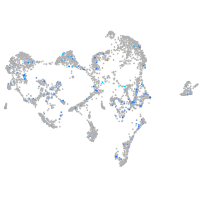
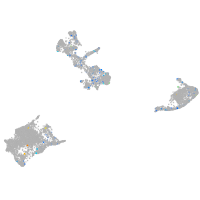
Gene expression UMAP
Display:
Expression
Stage
Other cell groups
all cells
blastomeres
PGCs
endoderm
axial mesoderm
muscle
mural cells /
non-skeletal muscle
mesenchyme
hematopoietic /
vasculature
pronephros
neural
spinal cord / glia
eye
taste / olfactory
otic / lateral line
epidermis
periderm
fin
ionocytes / mucous
pigment cells
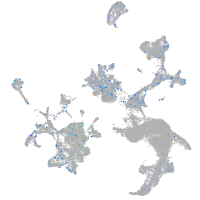
Expression by stage/cluster
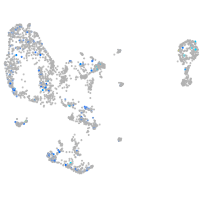
Correlated gene expression
Positive correlation
Negative correlation
Gene
r
Gene
r
LOC108183700
0.155
capsla
-0.050
XLOC-029568
0.146
hbbe1.2
-0.048
CR387932.1
0.146
si:dkey-148f10.4
-0.046
lenep
0.145
jakmip2
-0.046
LOC101886478
0.137
clstn2
-0.046
crygm2f
0.136
tet1
-0.046
taar19i
0.136
si:ch73-81k8.2
-0.044
hamp
0.131
hsbp1a
-0.044
si:dkeyp-80d11.10
0.130
chkb
-0.043
LOC100006752
0.127
kcnh5b
-0.043
si:dkey-35h6.1
0.124
b3gat1b
-0.043
col27a1a
0.124
kif1ab
-0.043
hoxa13a
0.123
ppp3ca
-0.042
duox
0.122
atf5a
-0.042
esr2a
0.120
gas7a
-0.041
pbld
0.120
zgc:112356
-0.041
LOC101882015
0.117
gnb5b
-0.041
si:dkey-27d5.14
0.116
cxxc5a
-0.041
alx4a
0.115
atp5md
-0.040
CABZ01073795.1
0.114
itgb1bp1
-0.040
LOC110439128
0.114
nptxrb
-0.040
si:ch73-252i11.1
0.113
cyp3c4
-0.039
itih2
0.113
ccdc114
-0.039
LO017850.1
0.113
daw1
-0.039
CR388417.2
0.113
tmed8
-0.039
ghrl
0.112
zdhhc6
-0.039
gipc1
0.112
pacrg
-0.039
cntln
0.108
akr1b1
-0.038
parp4
0.106
rap2ab
-0.038
CABZ01058222.1
0.105
map7d2a
-0.038
npnt
0.105
gpn2
-0.038
XLOC-038091
0.103
mef2b
-0.038
ankha
0.102
fam163b
-0.038
LO018020.2
0.102
coq8b
-0.038
CU469420.3
0.100
hbae3
-0.038