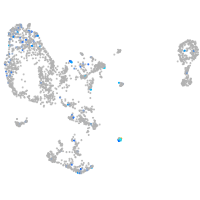
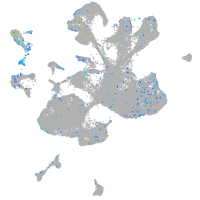
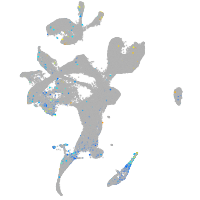
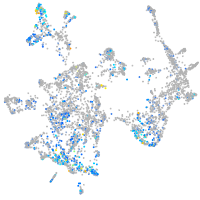
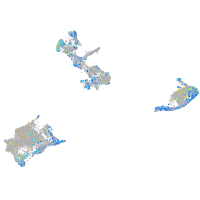
paralemmin 2 [Source:ZFIN;Acc:ZDB-GENE-050208-62]
ZFIN 
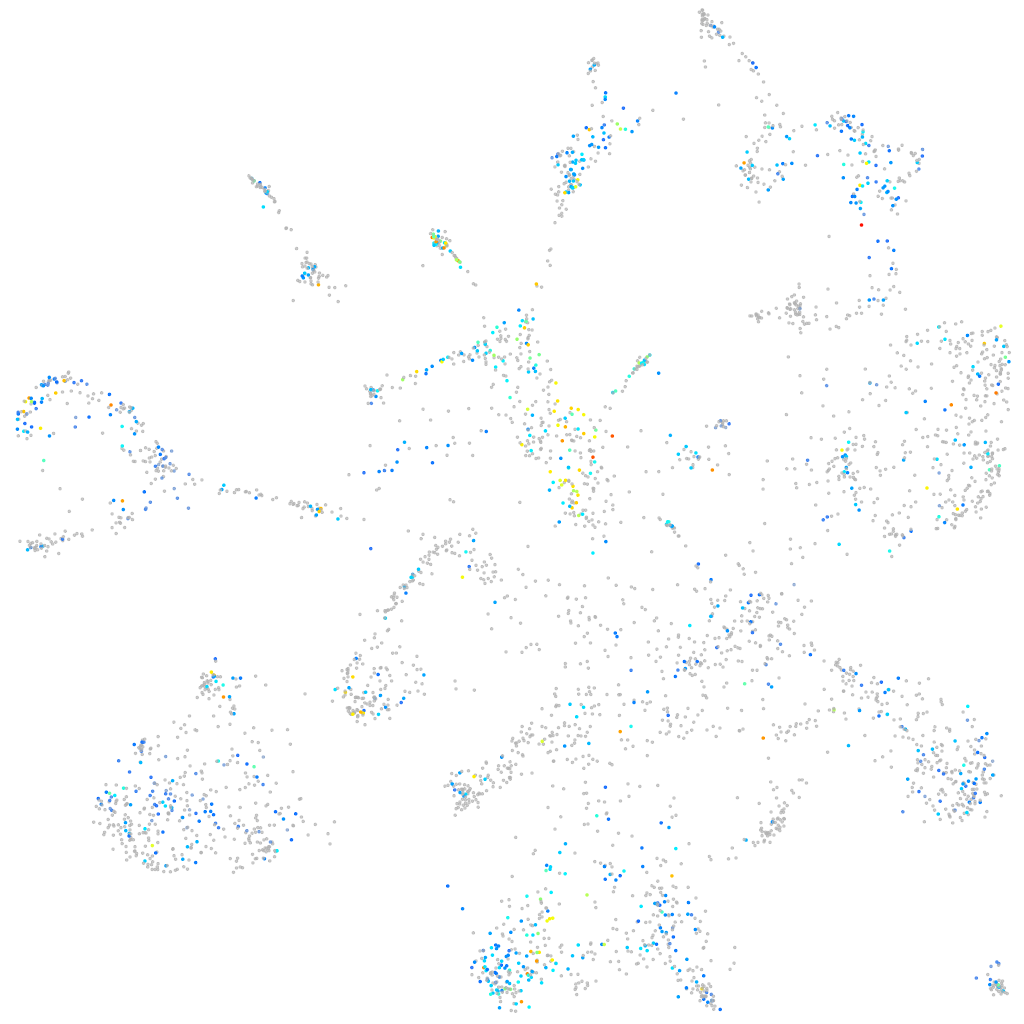
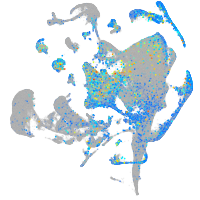
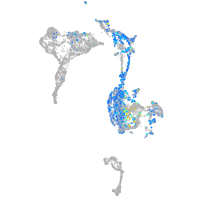
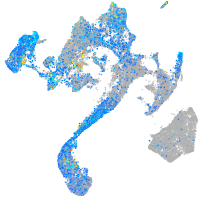
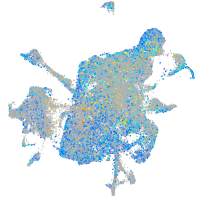
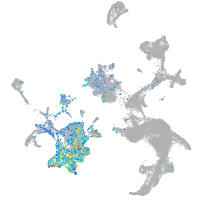
Expression by stage/cluster


Correlated gene expression


| Positive correlation | Negative correlation | ||
| Gene | r | Gene | r |
| myh11a | 0.217 | rps13 | -0.144 |
| tpm4b | 0.211 | zgc:114188 | -0.134 |
| flna | 0.193 | rps27.1 | -0.122 |
| mylka | 0.189 | rps20 | -0.121 |
| actn1 | 0.183 | rpl28 | -0.120 |
| tagln | 0.175 | rpl23 | -0.120 |
| myl9b | 0.175 | rps21 | -0.120 |
| tpm1 | 0.168 | rpl39 | -0.120 |
| notch3 | 0.167 | rpl22 | -0.120 |
| rasl12 | 0.162 | rps7 | -0.117 |
| acta2 | 0.159 | rpl10a | -0.116 |
| lmod1b | 0.158 | h3f3a | -0.114 |
| tln1 | 0.154 | rpl13a | -0.114 |
| itgb3b | 0.151 | rps15a | -0.111 |
| arhgap20b | 0.151 | nme2b.1 | -0.110 |
| akap12b | 0.150 | rpl21 | -0.107 |
| CU914776.1 | 0.148 | rpl19 | -0.107 |
| lpp | 0.148 | rplp1 | -0.106 |
| cnn1b | 0.147 | rps12 | -0.106 |
| tns1b | 0.146 | rpl7 | -0.105 |
| ahnak | 0.143 | rps23 | -0.102 |
| fermt2 | 0.141 | tmem88b | -0.100 |
| calm2a | 0.139 | rps15 | -0.100 |
| s1pr3a | 0.139 | rps2 | -0.099 |
| cd248a | 0.136 | fgf10a | -0.099 |
| actb2 | 0.136 | rps16 | -0.099 |
| itga4 | 0.135 | rpl12 | -0.098 |
| itga1 | 0.132 | h2afvb | -0.097 |
| stom | 0.131 | rps5 | -0.096 |
| tpm2 | 0.131 | hmgn2 | -0.096 |
| fstl1b | 0.131 | rps11 | -0.094 |
| myl9a | 0.130 | cpn1 | -0.093 |
| mprip | 0.130 | hmga1a | -0.092 |
| lamb1b | 0.130 | eef1b2 | -0.092 |
| bves | 0.129 | rps29 | -0.092 |


