
"palladin, cytoskeletal associated protein"
ZFIN 
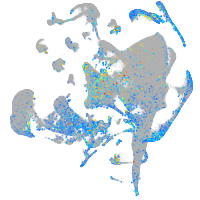
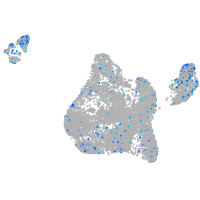
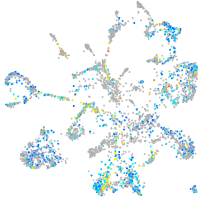
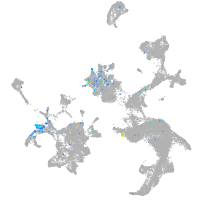
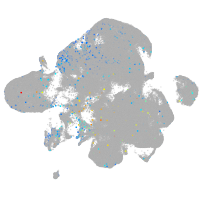
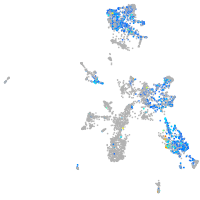
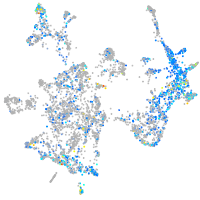
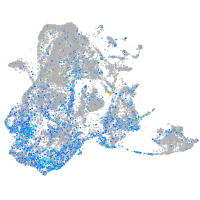
Gene expression UMAP


Expression by stage/cluster
Correlated gene expression
| Positive correlation | Negative correlation | ||
| Gene | r | Gene | r |
| frem2a | 0.315 | rplp1 | -0.185 |
| hapln3 | 0.313 | si:dkey-151g10.6 | -0.180 |
| fras1 | 0.309 | nme2b.1 | -0.163 |
| bcam | 0.290 | rpl39 | -0.157 |
| ecm2 | 0.286 | bhmt | -0.157 |
| itih5 | 0.285 | rpl26 | -0.157 |
| si:ch211-243g18.2 | 0.283 | hgd | -0.154 |
| rspo2 | 0.280 | ttc36 | -0.154 |
| col14a1a | 0.276 | pcbd1 | -0.153 |
| fstl1a | 0.273 | rpl23 | -0.151 |
| sp6 | 0.272 | fbln1 | -0.151 |
| frem1a | 0.271 | rps14 | -0.149 |
| egfl6 | 0.267 | qdpra | -0.147 |
| alpi.1 | 0.263 | rps23 | -0.145 |
| lama5 | 0.259 | rplp2l | -0.145 |
| si:ch211-194g2.4 | 0.247 | hpdb | -0.145 |
| myh9a | 0.243 | c1qtnf5 | -0.144 |
| col18a1a | 0.241 | rps19 | -0.143 |
| dag1 | 0.241 | ptx3a | -0.142 |
| cldni | 0.240 | rps26l | -0.141 |
| zgc:92380 | 0.239 | gpc1a | -0.138 |
| qpct | 0.238 | rpl37 | -0.135 |
| sp9 | 0.238 | pah | -0.135 |
| rac2 | 0.235 | twist1a | -0.133 |
| lamc1 | 0.235 | rpl12 | -0.132 |
| thy1 | 0.235 | rps25 | -0.130 |
| tagln2 | 0.234 | rps10 | -0.130 |
| nid2a | 0.234 | rpl31 | -0.130 |
| vcana | 0.233 | rps21 | -0.129 |
| dlx4a | 0.232 | rps24 | -0.129 |
| si:ch211-246m6.5 | 0.232 | cd82a | -0.129 |
| tspearb | 0.229 | rpl10a | -0.128 |
| bcl2l10 | 0.229 | rps15a | -0.128 |
| s100a10b | 0.228 | mdh1aa | -0.127 |
| bmp2b | 0.226 | rps28 | -0.126 |