Daniocell
pag1 (periderm)
phosphoprotein membrane anchor with glycosphingolipid microdomains 1
ZFIN
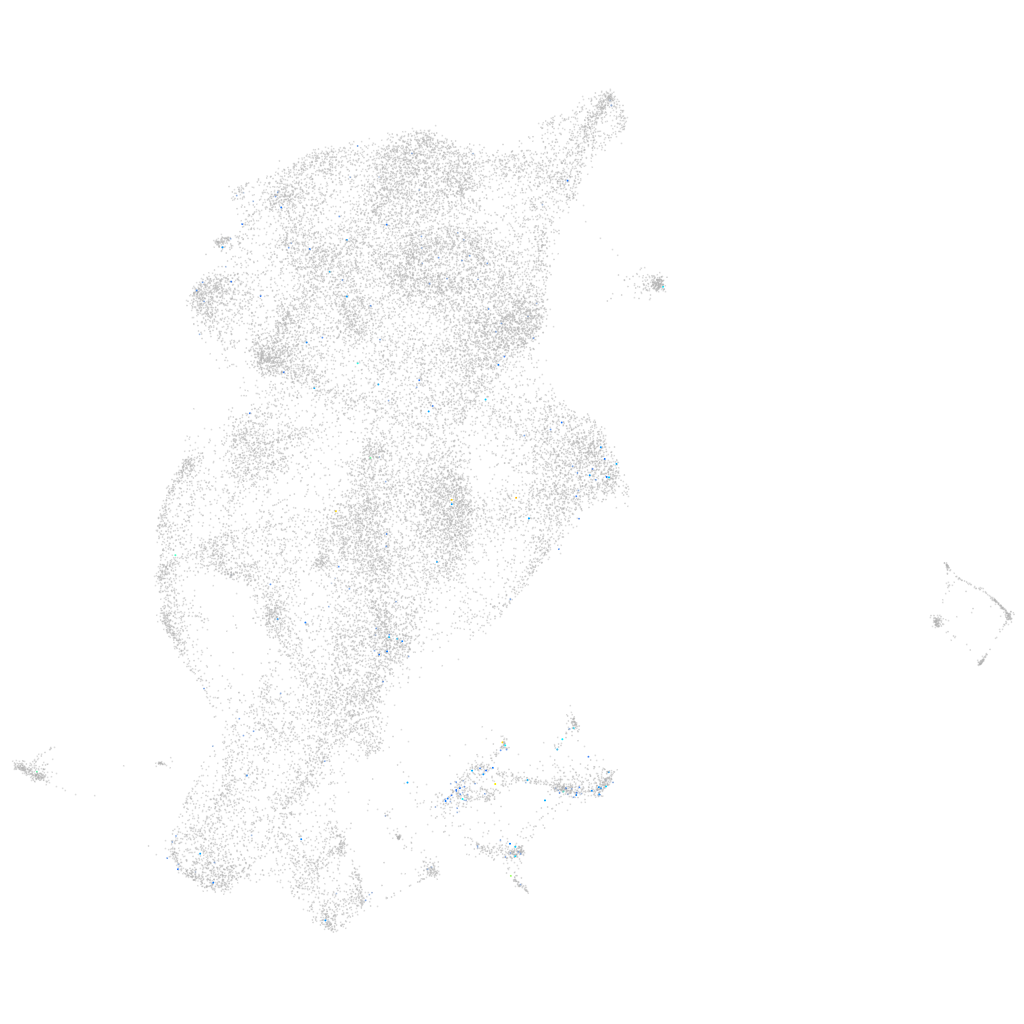
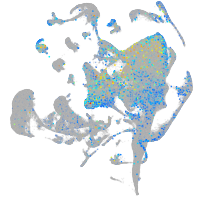
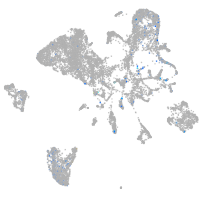
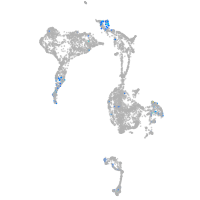
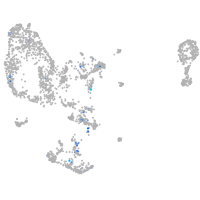
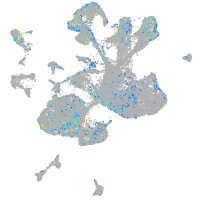
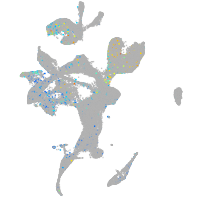
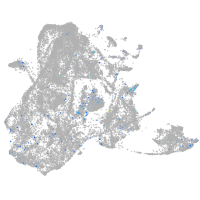
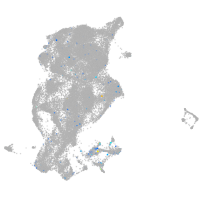
Gene expression UMAP
Display:
Expression
Stage
Other cell groups
all cells
blastomeres
PGCs
endoderm
axial mesoderm
muscle
mural cells /
non-skeletal muscle
mesenchyme
hematopoietic /
vasculature
pronephros
neural
spinal cord / glia
eye
taste / olfactory
otic / lateral line
epidermis
periderm
fin
ionocytes / mucous
pigment cells
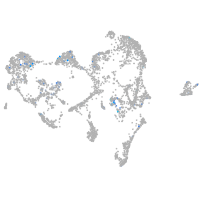
Expression by stage/cluster
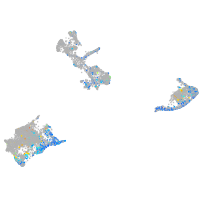
Correlated gene expression
Positive correlation
Negative correlation
Gene
r
Gene
r
gper1
0.184
cyt1
-0.034
CABZ01076968.1
0.149
krt5
-0.030
abi3a
0.149
ahcy
-0.027
LOC108191357
0.147
cfl1l
-0.027
si:ch211-243o19.4
0.131
zgc:193505
-0.026
reln
0.124
krt4
-0.026
XLOC-043372
0.123
cyt1l
-0.026
CABZ01053976.1
0.116
zgc:175088
-0.025
LOC101885479.1
0.113
ckap4
-0.025
btr07
0.112
agr1
-0.025
CR855300.1
0.111
si:ch73-52f15.5
-0.025
cx31.7
0.102
sh3gl1a
-0.024
LOC108183430
0.100
si:ch211-195b11.3
-0.023
mfge8a
0.097
naca
-0.023
si:ch211-162k9.6
0.096
krtt1c19e
-0.023
si:ch211-66e2.5
0.095
mgarp
-0.023
LOC100334937
0.095
eevs
-0.022
serinc4
0.093
pnp5a
-0.022
zgc:165461
0.093
mgst1.2
-0.021
slc24a4b
0.093
anxa1a
-0.021
cx43
0.092
stard14
-0.021
sept8b
0.091
si:dkeyp-86h10.3
-0.021
glrbb
0.091
pof1b
-0.021
gpm6aa
0.091
mgst2
-0.020
vav3
0.090
wu:fb18f06
-0.020
nav3
0.089
cst14b.1
-0.020
saga
0.089
zgc:64106
-0.020
phlpp2
0.089
capns1a
-0.020
si:dkey-87k14.1
0.089
FP236513.1
-0.020
tmie
0.089
mapre1a
-0.019
cspg5a
0.089
si:ch211-121a2.2
-0.019
slc13a5a
0.088
aldh9a1a.1
-0.019
jakmip2
0.088
pabpc1a
-0.019
slc1a2b
0.087
dhrs13a.2
-0.019
XLOC-021256
0.086
eef1da
-0.019