Daniocell
oxsr1b (taste / olfactory)
oxidative stress responsive kinase 1b
ZFIN
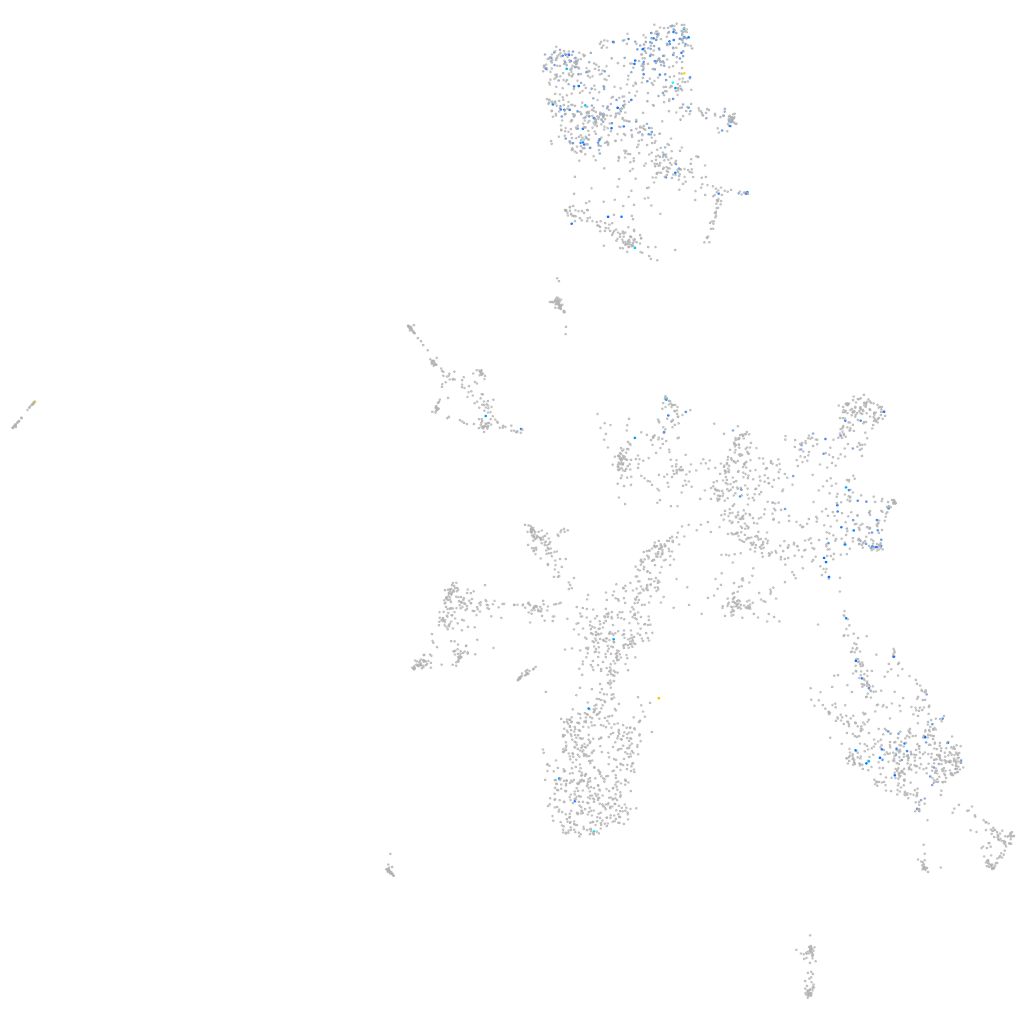
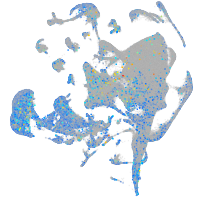
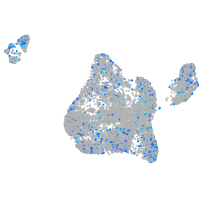
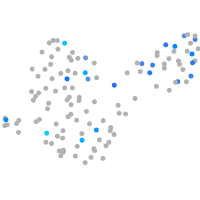
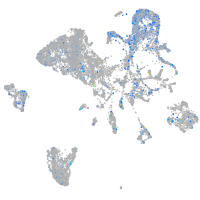
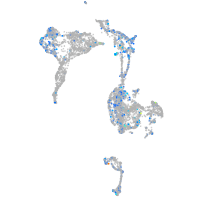
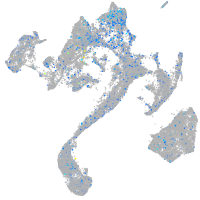
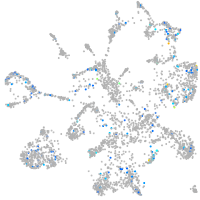
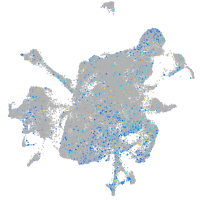
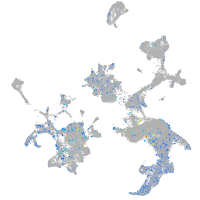
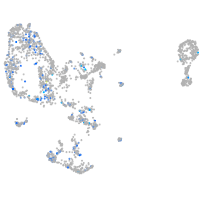
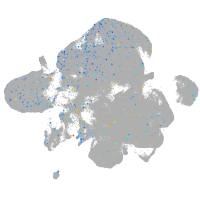
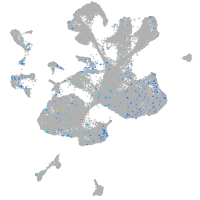
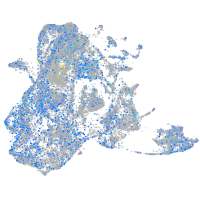
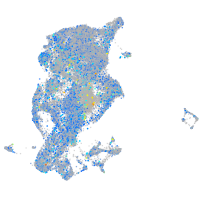
Gene expression UMAP
Display:
Expression
Stage
Other cell groups
all cells
blastomeres
PGCs
endoderm
axial mesoderm
muscle
mural cells /
non-skeletal muscle
mesenchyme
hematopoietic /
vasculature
pronephros
neural
spinal cord / glia
eye
taste / olfactory
otic / lateral line
epidermis
periderm
fin
ionocytes / mucous
pigment cells
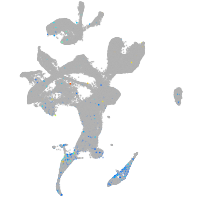
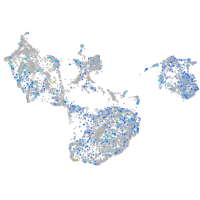
Expression by stage/cluster
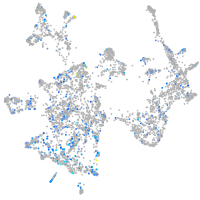
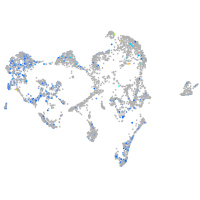
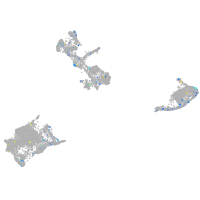
Correlated gene expression
Positive correlation
Negative correlation
Gene
r
Gene
r
ltb4r
0.262
elavl3
-0.155
si:dkey-265e7.1
0.262
tuba1a
-0.132
CR339041.2
0.257
insm1a
-0.130
CABZ01046088.1
0.245
tspan2a
-0.129
LOC100000545
0.233
zgc:65894
-0.128
ponzr5
0.229
rtn1a
-0.126
megf6a
0.228
tmsb
-0.119
serpind1
0.223
LOC100537342
-0.115
adamts6
0.218
sncb
-0.115
ppl
0.215
stmn1b
-0.115
krt92
0.214
chga
-0.113
si:dkey-45k15.1
0.213
pvalb5
-0.113
si:dkey-19b23.12
0.213
si:dkeyp-75h12.5
-0.111
scel
0.205
epb41a
-0.111
cdhr1a
0.202
atf5a
-0.110
evplb
0.200
capsla
-0.109
si:cabz01007794.1
0.198
si:dkey-276j7.1
-0.108
si:ch211-125o16.4
0.198
adcyap1b
-0.108
dlgap2a
0.194
scg2b
-0.108
XLOC-043013
0.191
si:ch211-10a23.2
-0.106
anxa3a
0.191
atp2b1a
-0.105
zgc:66484
0.191
gng3
-0.105
agr1
0.190
hsbp1a
-0.105
si:ch73-347e22.8
0.190
ptmaa
-0.104
zgc:193505
0.189
si:ch211-153b23.5
-0.103
si:ch211-157c3.4
0.189
gnao1a
-0.103
zgc:165423
0.186
olfm1b
-0.102
rhoub
0.184
bcl11ba
-0.102
gucy2c
0.184
tmeff1b
-0.101
ociad2
0.182
zgc:55461
-0.100
krt1-19d
0.182
myt1a
-0.099
si:ch73-199e17.1
0.181
si:ch73-335l21.2
-0.099
jac1
0.181
ncam1a
-0.098
zgc:153665
0.180
ebf3a
-0.098
LOC100536671
0.180
ank2b
-0.096