Daniocell
nos1apa (periderm)
nitric oxide synthase 1 (neuronal) adaptor protein a
ZFIN
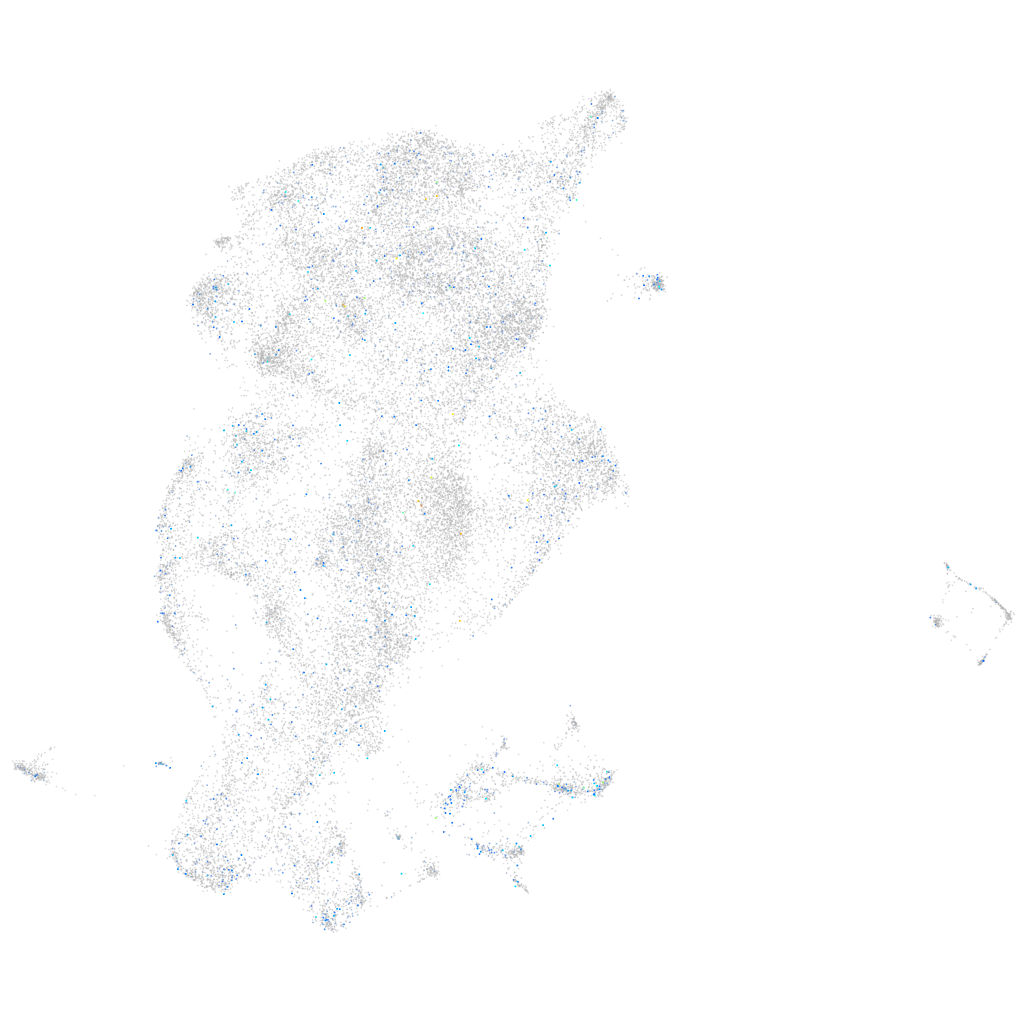
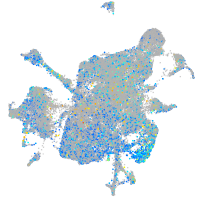
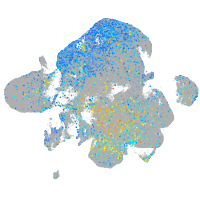
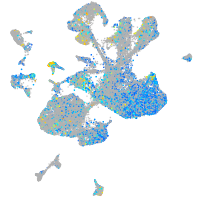
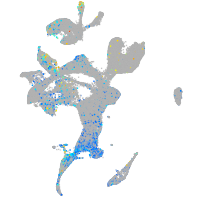
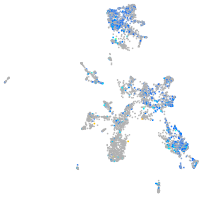
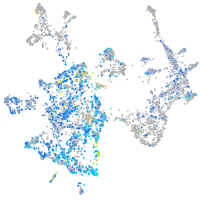
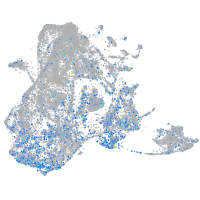
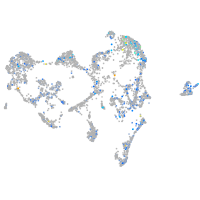
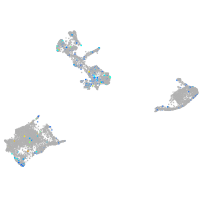
Gene expression UMAP
Display:
Expression
Stage
Other cell groups
all cells
blastomeres
PGCs
endoderm
axial mesoderm
muscle
mural cells /
non-skeletal muscle
mesenchyme
hematopoietic /
vasculature
pronephros
neural
spinal cord / glia
eye
taste / olfactory
otic / lateral line
epidermis
periderm
fin
ionocytes / mucous
pigment cells
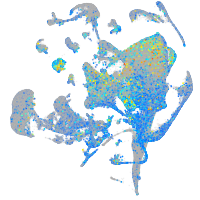
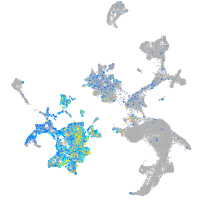
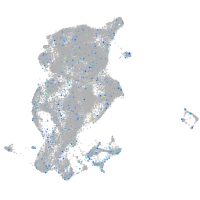
Expression by stage/cluster
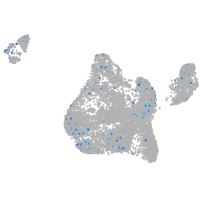
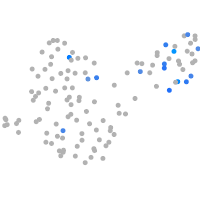
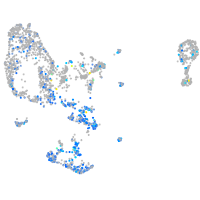
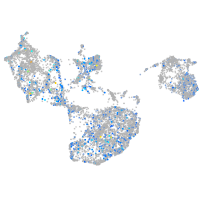
Correlated gene expression
Positive correlation
Negative correlation
Gene
r
Gene
r
cbln7
0.105
krt4
-0.067
XLOC-018977
0.102
cyt1
-0.059
BX545917.4
0.084
cyt1l
-0.057
marcksl1a
0.083
si:ch211-195b11.3
-0.054
gcgrb
0.079
zgc:193505
-0.051
LOC103909524
0.079
wu:fb18f06
-0.044
rsph9
0.078
krt5
-0.043
tmem88b
0.077
selenow1
-0.041
mt-cyb
0.073
cfl1l
-0.041
nos1apb
0.073
si:dkey-16p21.8
-0.040
CABZ01015105.1
0.072
krtt1c19e
-0.039
pmp22a
0.072
icn2
-0.039
inppl1b
0.071
zgc:175088
-0.035
mt-co2
0.070
aldob
-0.032
CABZ01109481.1
0.070
btf3
-0.031
CR383676.1
0.070
selenow2b
-0.031
mt-nd1
0.069
si:ch73-52f15.5
-0.030
cdh5
0.069
icn
-0.028
LOC110438084
0.069
s100v2
-0.028
si:ch73-140j24.4
0.069
ahcy
-0.028
tns1b
0.069
glo1
-0.027
si:ch211-222l21.1
0.069
zgc:153284
-0.026
AL935044.1
0.068
rpl39
-0.026
zgc:158432
0.068
s100w
-0.026
cd81a
0.067
gstp1
-0.026
dact3a
0.067
eevs
-0.025
si:ch211-186e20.7
0.067
krt17
-0.024
hmga2
0.067
rps26l
-0.024
hmgb1b
0.066
tcnbb
-0.024
AL954359.1
0.066
actb2
-0.023
LOC103910598
0.066
ponzr3
-0.023
mt-atp6
0.066
smdt1b
-0.023
cald1b
0.066
agr1
-0.023
LOC100334341
0.065
pycard
-0.022
ap1s2
0.064
rps29
-0.022