Daniocell
nmi (ionocytes / mucous-producing)
N-myc (and STAT) interactor
ZFIN
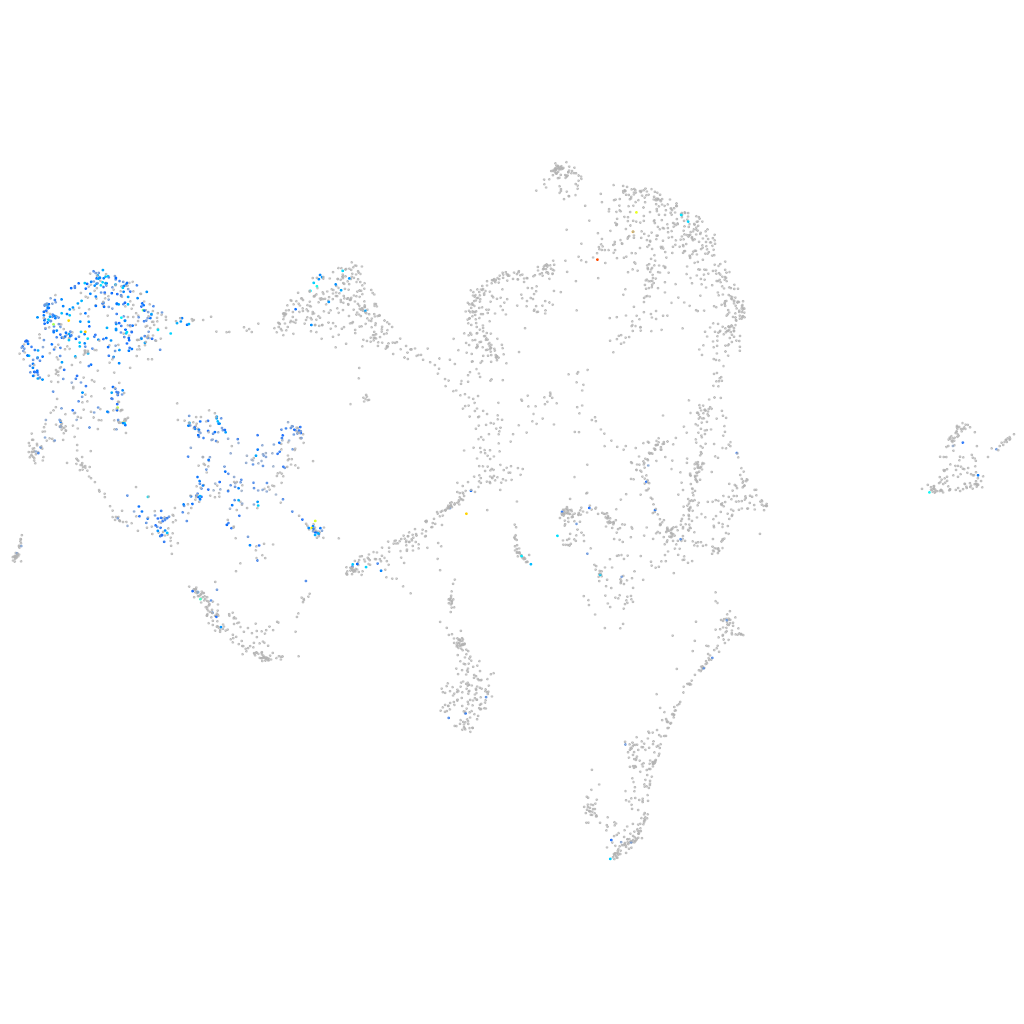
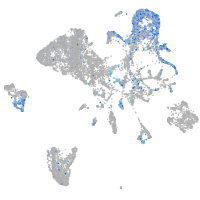
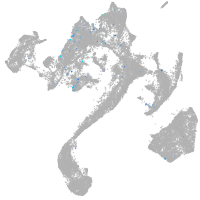
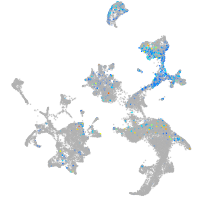
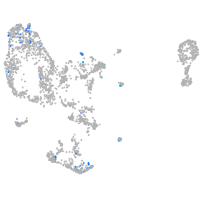
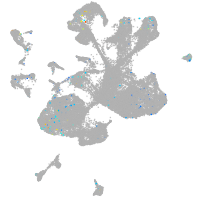
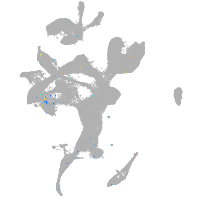
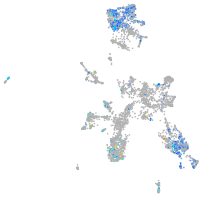
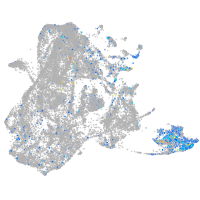
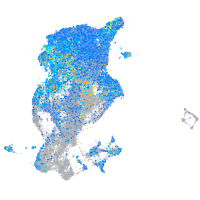
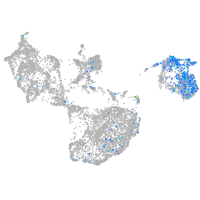
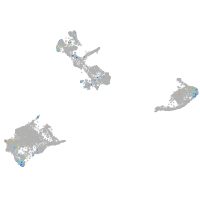
Gene expression UMAP
Display:
Expression
Stage
Other cell groups
all cells
blastomeres
PGCs
endoderm
axial mesoderm
muscle
mural cells /
non-skeletal muscle
mesenchyme
hematopoietic /
vasculature
pronephros
neural
spinal cord / glia
eye
taste / olfactory
otic / lateral line
epidermis
periderm
fin
ionocytes / mucous
pigment cells
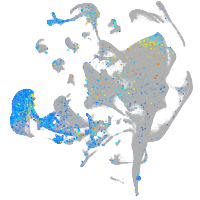
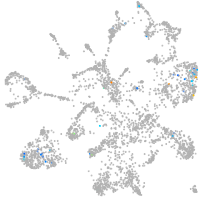
Expression by stage/cluster
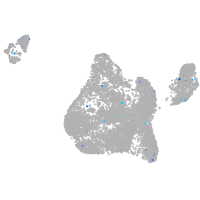
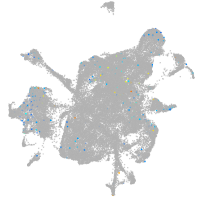
Correlated gene expression
Positive correlation
Negative correlation
Gene
r
Gene
r
si:ch211-207n23.2
0.540
ptmab
-0.222
zgc:111983
0.522
si:ch211-222l21.1
-0.200
si:ch73-52f15.5
0.484
h2afvb
-0.196
stx11b.1
0.480
tmed4
-0.191
si:dkeyp-51b9.3
0.468
h3f3a
-0.191
dhrs13a.2
0.463
tma7
-0.187
si:dkeyp-1h4.6
0.457
hmgn2
-0.184
rhcga
0.444
hmgn3
-0.183
XLOC-011066
0.440
hmga1a
-0.179
wu:fa03e10
0.437
si:ch73-281n10.2
-0.178
si:ch211-125o16.4
0.437
calr3b
-0.177
scel
0.427
fabp3
-0.176
CABZ01027551.1
0.420
ssr3
-0.165
si:ch211-217k17.9
0.415
krt18a.1
-0.164
rhcgl1
0.412
capn8
-0.164
apodb
0.408
hmgn6
-0.163
elovl7b
0.408
s100u
-0.160
si:dkey-222n6.2
0.405
ilf2
-0.160
abcb5
0.403
ptmaa
-0.159
stard14
0.403
sub1a
-0.159
tcnbb
0.400
aldoaa
-0.159
si:dkey-221j11.3
0.393
rab5if
-0.156
krt17
0.393
sf3b5
-0.154
lye
0.391
stmn1a
-0.152
si:ch211-157c3.4
0.390
ddost
-0.151
zgc:163030
0.385
tmco1
-0.151
si:ch73-204p21.2
0.383
tspan7
-0.150
pnp5a
0.376
magoh
-0.149
mgst1.2
0.375
hspe1
-0.149
anxa1b
0.373
tomm40l
-0.149
ch25hl1.1
0.372
myl12.2
-0.148
anxa1c
0.371
tmx2b
-0.148
tlcd1
0.366
clta
-0.146
mid1ip1a
0.365
slc39a7
-0.146
si:dkey-247k7.2
0.363
spcs2
-0.146