Daniocell
nkd3 (taste / olfactory)
NKD inhibitor of WNT signaling pathway 3
ZFIN
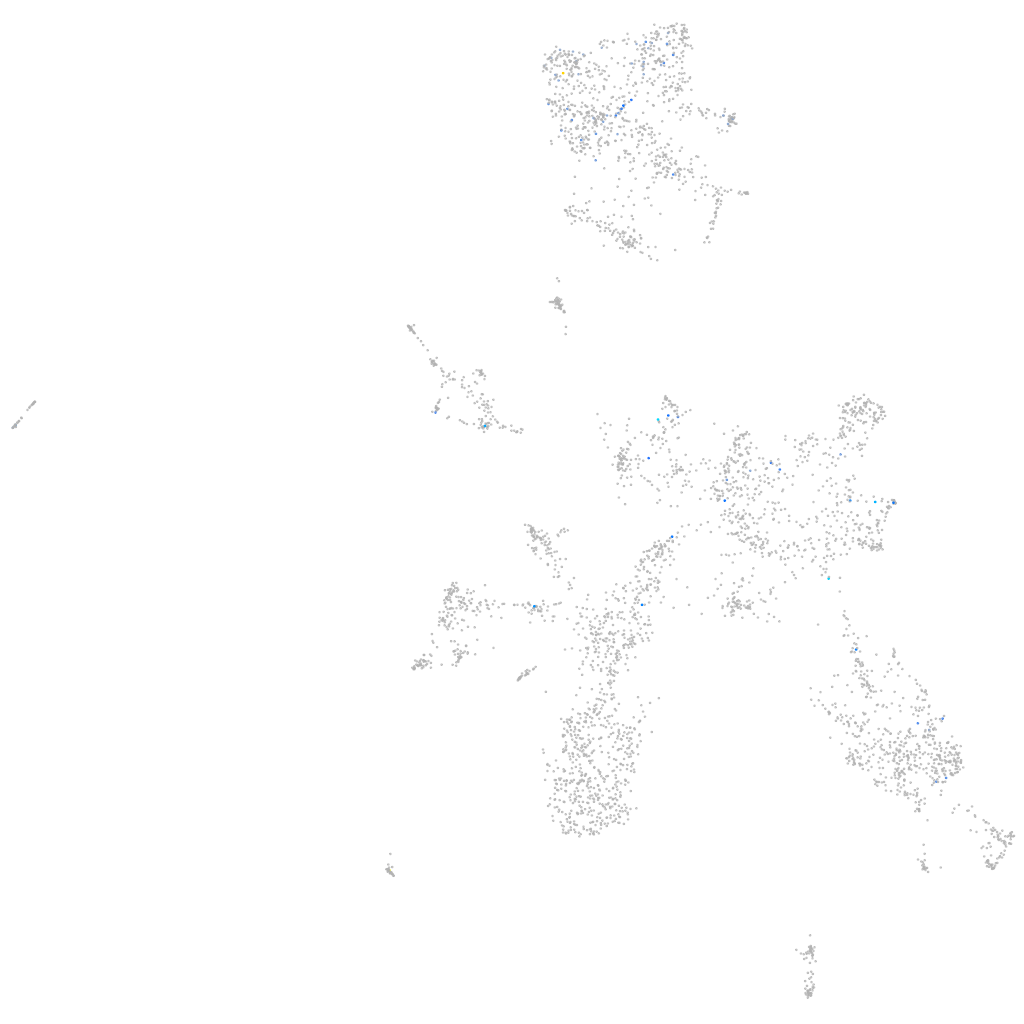
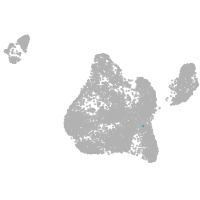
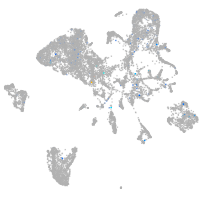
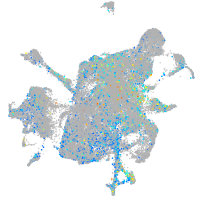
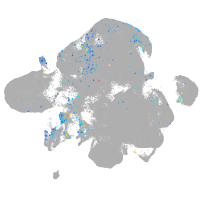
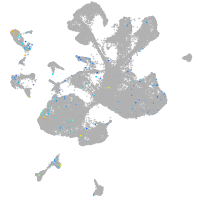
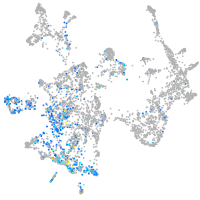
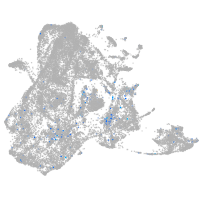
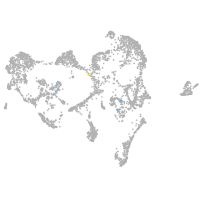
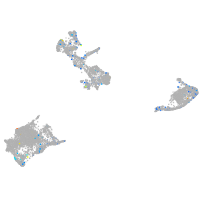
Gene expression UMAP
Display:
Expression
Stage
Other cell groups
all cells
blastomeres
PGCs
endoderm
axial mesoderm
muscle
mural cells /
non-skeletal muscle
mesenchyme
hematopoietic /
vasculature
pronephros
neural
spinal cord / glia
eye
taste / olfactory
otic / lateral line
epidermis
periderm
fin
ionocytes / mucous
pigment cells
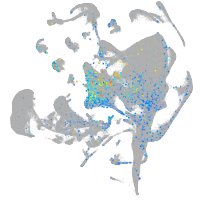
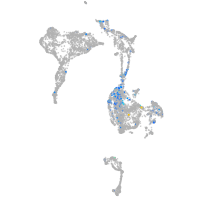
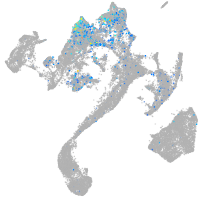
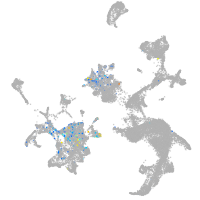
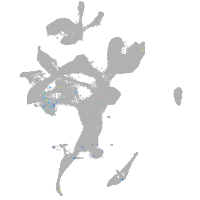
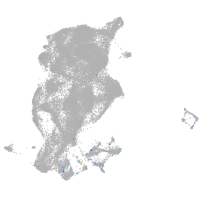
Expression by stage/cluster
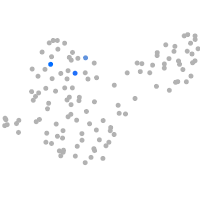
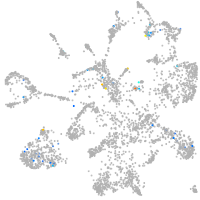
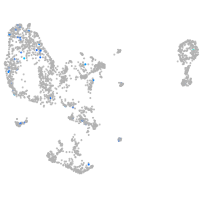
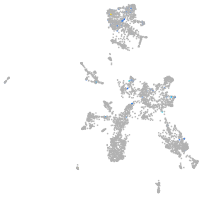
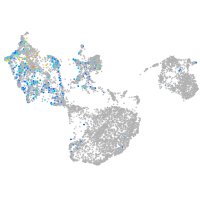
Correlated gene expression
Positive correlation
Negative correlation
Gene
r
Gene
r
kiaa1549lb
0.420
si:ch211-153b23.5
-0.066
lrrc15
0.399
pvalb5
-0.062
si:ch211-258f1.3
0.355
ptmaa
-0.060
tbx16
0.294
tspan2a
-0.057
adrb2b
0.293
gng13b
-0.056
ch25hl2
0.275
atf5a
-0.055
CR847970.1
0.272
fabp10b
-0.055
si:dkey-35m8.1
0.251
chga
-0.054
esamb
0.239
TSTD1
-0.054
otofb
0.238
adcyap1b
-0.054
BX649300.2
0.237
map1b
-0.054
si:dkey-261j4.4
0.213
nsg2
-0.053
LOC101884685
0.212
olfm1b
-0.052
GRIK2
0.210
fstl5
-0.051
fscn1b
0.204
zgc:65894
-0.051
wasb
0.200
pde6d
-0.051
cdhr5a
0.199
capsla
-0.051
si:dkey-231j24.3
0.194
nrsn1
-0.050
qkib
0.192
abhd2b
-0.050
tatdn2
0.184
fthl31
-0.049
CU928117.1
0.184
zgc:55461
-0.049
CABZ01074886.1
0.184
LOC100537342
-0.049
tnr
0.180
XLOC-024343
-0.047
CABZ01038376.1
0.179
spock1
-0.047
LOC103911201
0.178
si:dkeyp-75h12.5
-0.047
ppp1r3aa
0.178
b3gat1b
-0.046
gcga
0.177
fthl30
-0.046
kcna1a
0.174
mycbp
-0.046
cacng8a
0.169
ompb
-0.046
XLOC-016022
0.166
flrt1b
-0.045
si:dkey-60d5.3
0.165
sprn2
-0.045
BX088649.1
0.164
gnal
-0.044
si:dkey-260c8.6
0.159
nxnl2
-0.044
XLOC-013624
0.159
syt11a
-0.044
opcml
0.158
si:ch211-10a23.2
-0.044