Daniocell
nfkb2 (taste / olfactory)
nuclear factor of kappa light polypeptide gene enhancer in B-cells 2 (p49/p100)
ZFIN
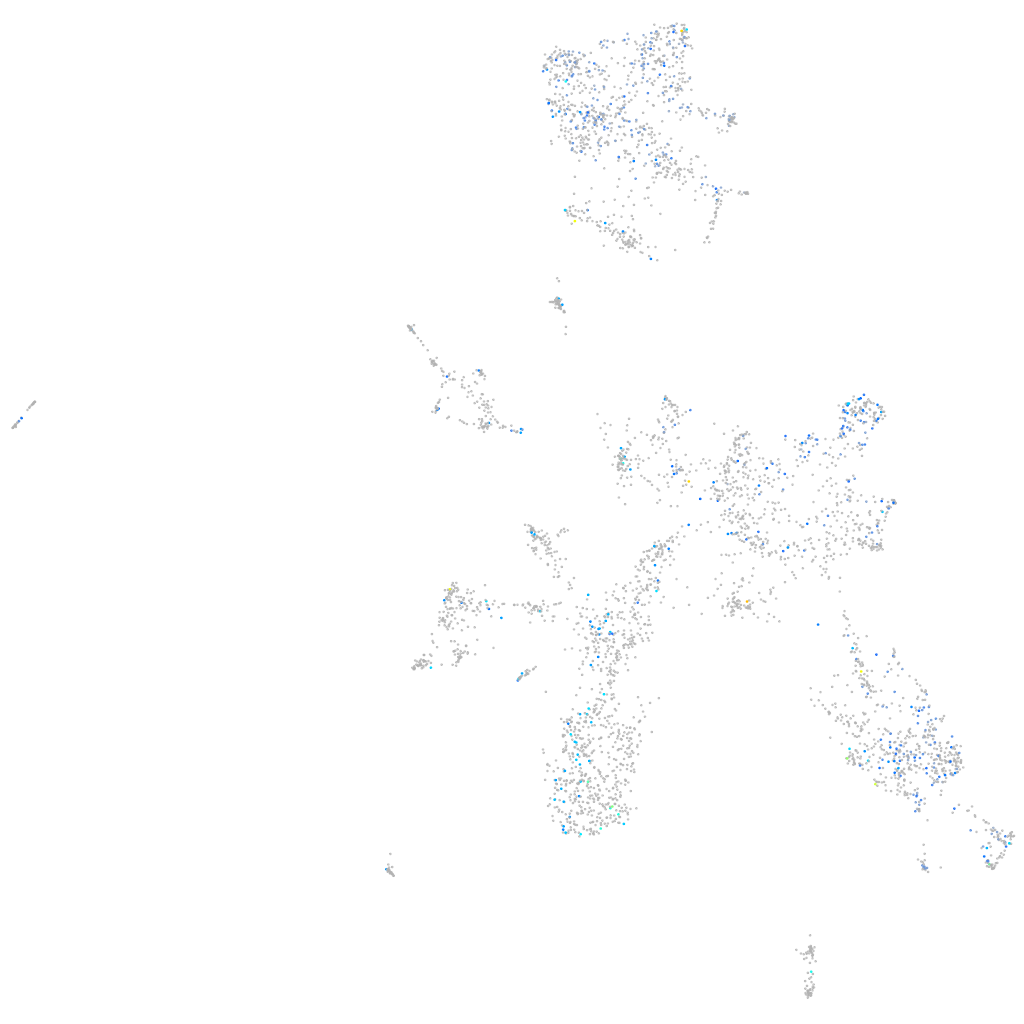
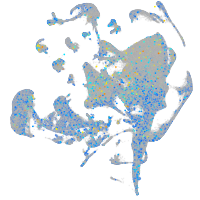
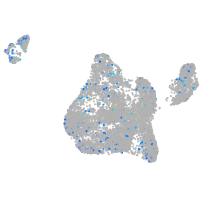
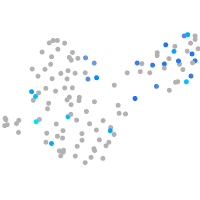
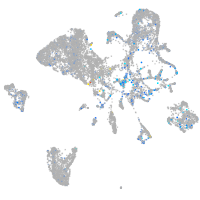
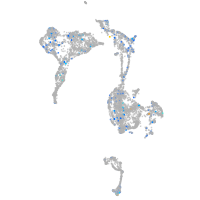
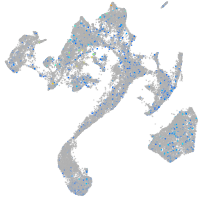
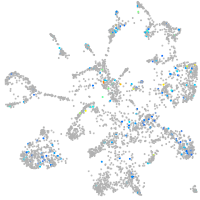
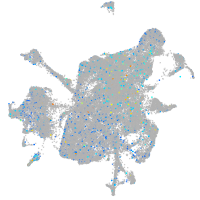
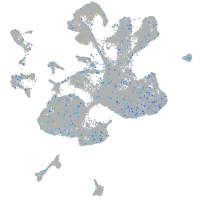
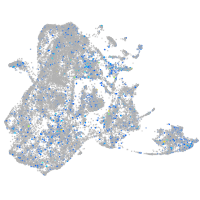
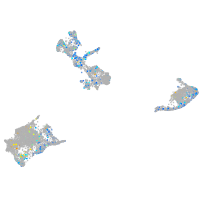
Gene expression UMAP
Display:
Expression
Stage
Other cell groups
all cells
blastomeres
PGCs
endoderm
axial mesoderm
muscle
mural cells /
non-skeletal muscle
mesenchyme
hematopoietic /
vasculature
pronephros
neural
spinal cord / glia
eye
taste / olfactory
otic / lateral line
epidermis
periderm
fin
ionocytes / mucous
pigment cells
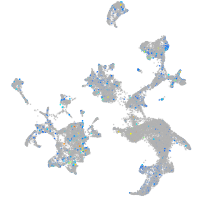
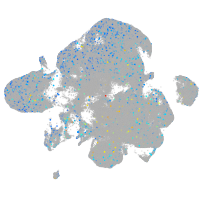
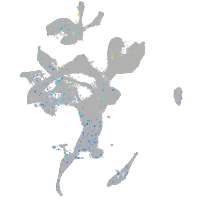
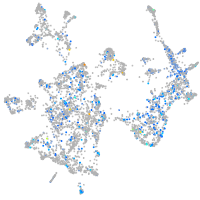
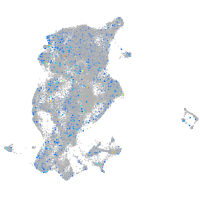
Expression by stage/cluster
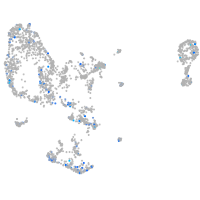
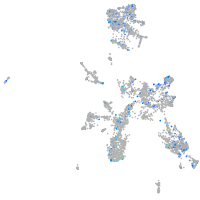
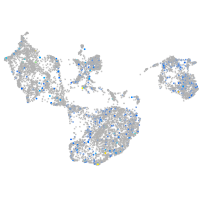
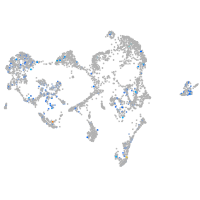
Correlated gene expression
Positive correlation
Negative correlation
Gene
r
Gene
r
LOC110439879
0.142
CU467822.1
-0.061
CR589944.2
0.124
XLOC-003692
-0.048
XLOC-031373
0.122
her4.2
-0.048
si:dkeyp-35e5.5
0.117
her4.4
-0.045
tnfaip2b
0.112
tnni2a.4
-0.042
map1lc3cl
0.111
rcc2
-0.042
LOC101886459
0.110
LOC101884747
-0.041
LOC108183801
0.109
hnrnpm
-0.041
LOC103909479
0.109
nhlh2
-0.040
si:dkey-23a13.6
0.108
LOC100536647
-0.039
dpp4
0.106
MZT1
-0.039
si:ch211-207e19.2
0.105
gadd45gb.1
-0.038
arhgap31
0.104
neurod4
-0.037
kcnj1a.6
0.103
LO018197.1
-0.036
tdrd9
0.103
ube3d
-0.036
LOC101882492
0.101
si:dkey-178k16.1
-0.036
BX511067.1
0.100
cyfip2
-0.036
fat1b
0.100
polr2c
-0.036
AL928977.1
0.100
chodl
-0.036
fut10
0.098
jag2b
-0.036
crygm2d2
0.097
ctrb1
-0.035
CR762483.1
0.097
fcf1
-0.035
nfkbiab
0.095
apex1
-0.035
XLOC-013081
0.094
inka1a
-0.035
LOC100536726
0.094
rps29
-0.035
BX511073.1
0.094
sox11b
-0.035
LOC103911913
0.093
odc1
-0.035
LOC110437787
0.093
nmt2
-0.035
CABZ01048956.1
0.093
tfdp2
-0.035
LO018490.1
0.092
tprg1l
-0.035
MYL2
0.091
nid1b
-0.035
LOC103910022
0.091
yme1l1a
-0.034
si:ch73-368j24.14
0.090
sept3
-0.034
smox
0.090
pde9al
-0.034
AL807792.1
0.090
hmgb3b
-0.034