Daniocell
napepld (blastomeres)
N-acyl phosphatidylethanolamine phospholipase D
ZFIN
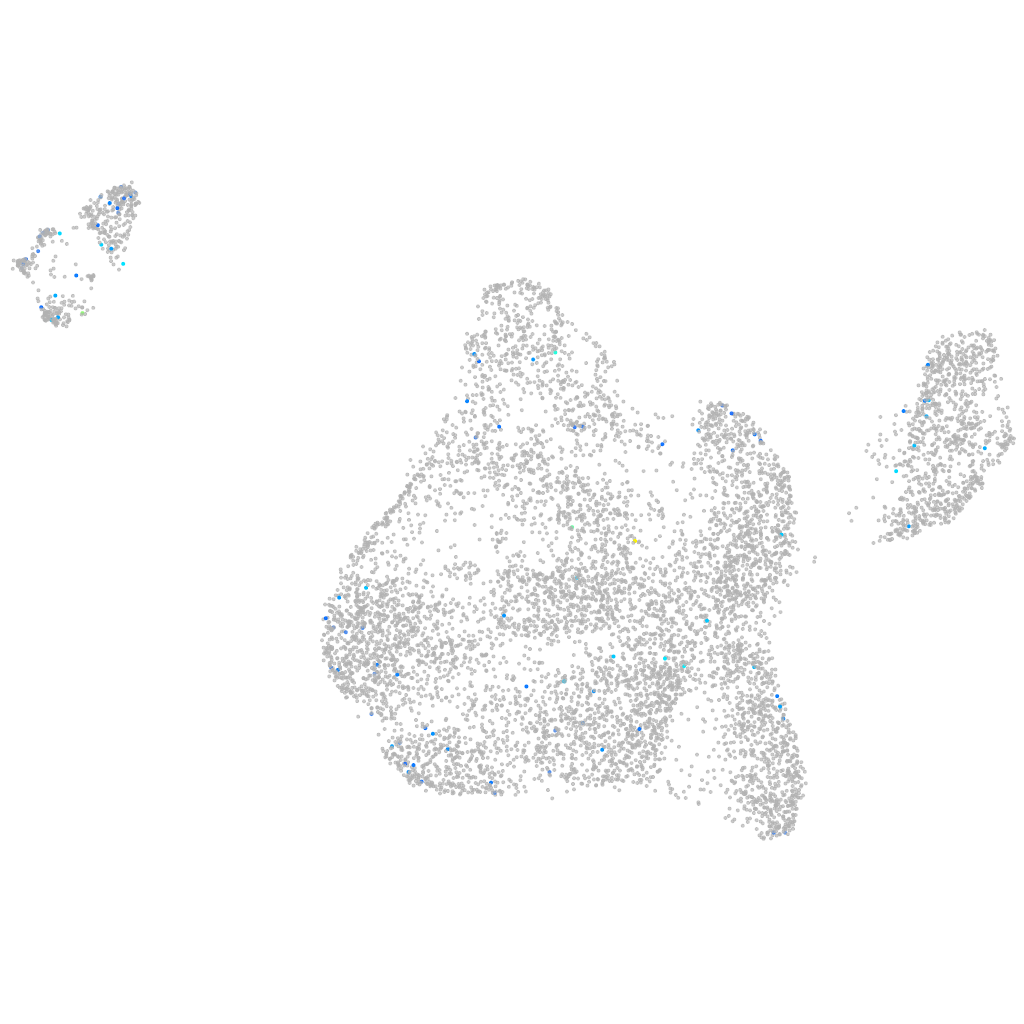
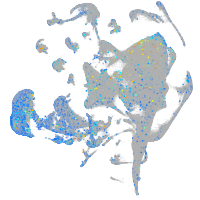
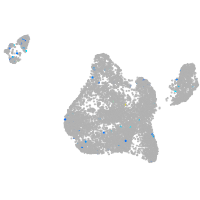
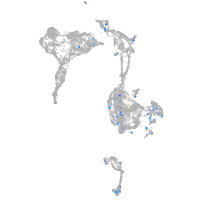
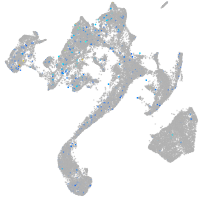
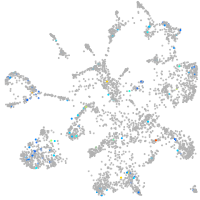
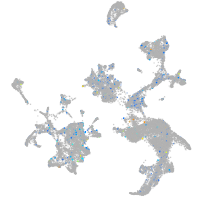
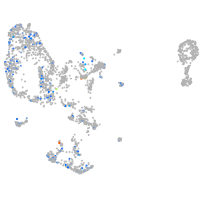
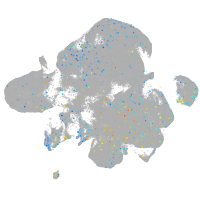
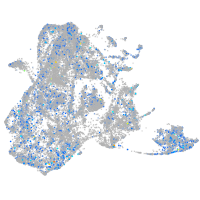
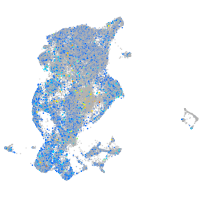
Gene expression UMAP
Display:
Expression
Stage
Other cell groups
all cells
blastomeres
PGCs
endoderm
axial mesoderm
muscle
mural cells /
non-skeletal muscle
mesenchyme
hematopoietic /
vasculature
pronephros
neural
spinal cord / glia
eye
taste / olfactory
otic / lateral line
epidermis
periderm
fin
ionocytes / mucous
pigment cells
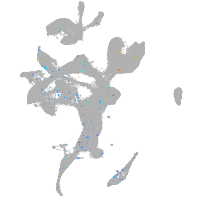
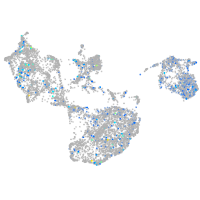
Expression by stage/cluster
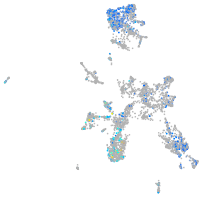
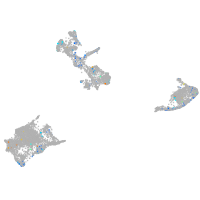
Correlated gene expression
Positive correlation
Negative correlation
Gene
r
Gene
r
stmn3
0.158
marcksl1b
-0.083
a1cf
0.153
ptmab
-0.080
arg1
0.129
stm
-0.080
CR293508.1
0.127
si:ch73-1a9.3
-0.079
inpp5jb
0.127
si:dkey-151g10.6
-0.078
cyp11a2
0.125
hnrnpa0b
-0.071
abcg4b
0.124
si:ch211-222l21.1
-0.071
ifng1
0.121
hmgb2a
-0.069
XLOC-008029
0.121
aldob
-0.067
blnk
0.117
dynll1
-0.065
zgc:194443
0.115
rpl39
-0.064
FP016005.1
0.113
hmga1a
-0.063
LOC108183658
0.112
hmgn6
-0.062
ecm2
0.109
hspb1
-0.061
pvalb7
0.108
polr3gla
-0.060
BX957322.2
0.108
rps20
-0.060
KCNN2
0.103
si:ch211-152c2.3
-0.059
hamp
0.103
rps19
-0.059
CU862015.1
0.102
rps21
-0.057
si:ch211-234p6.5
0.100
rpl36
-0.056
LOC103910876
0.100
rpl35a
-0.055
si:ch211-163g19.2
0.099
rplp1
-0.055
LOC101883873
0.099
rpl32
-0.054
LOC101882775
0.099
rps12
-0.054
lad1
0.094
cox7c
-0.051
si:ch73-54f23.4
0.094
apoeb
-0.051
enpp6
0.092
rplp2l
-0.051
adora1b
0.092
ncl
-0.051
cps1
0.091
nucks1a
-0.050
myct1b
0.090
anp32a
-0.050
XLOC-023335
0.090
cirbpa
-0.049
si:ch73-380l3.5
0.090
akap12b
-0.049
BX005392.3
0.090
eef1a1l1
-0.049
boka
0.090
si:ch73-281n10.2
-0.048
traf4a
0.089
rps26
-0.048