Daniocell
nanp (glial cells / spinal cord)
N-acetylneuraminic acid phosphatase
ZFIN
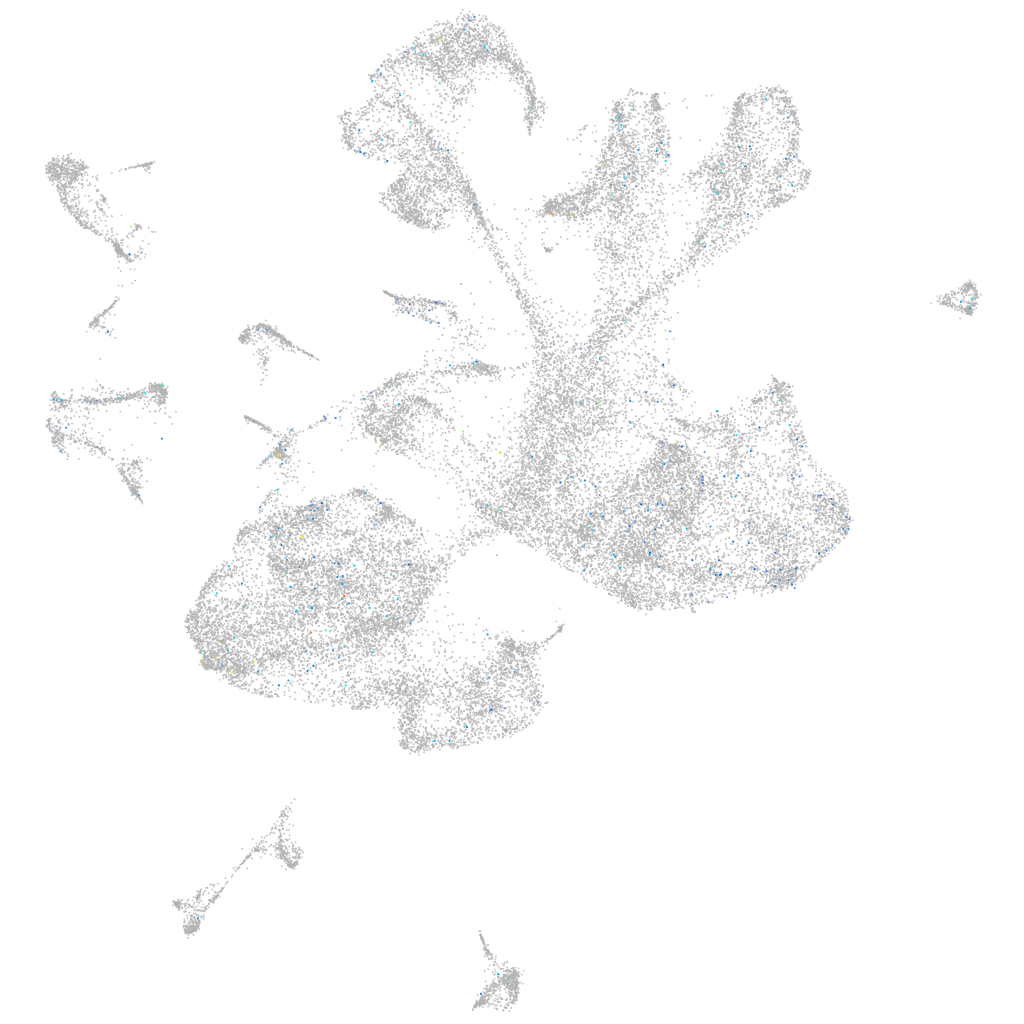
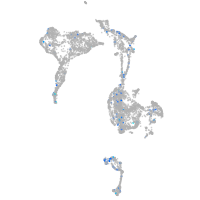
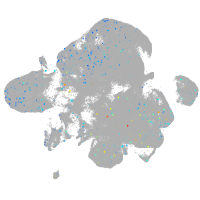
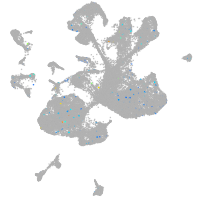
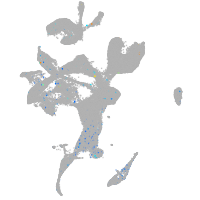
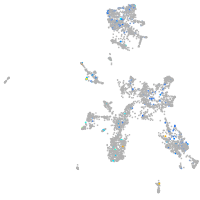
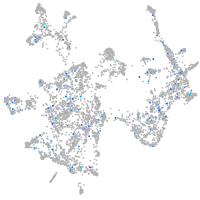
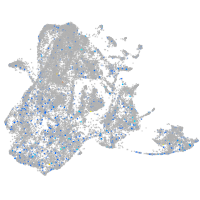
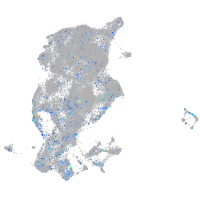
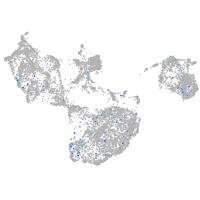
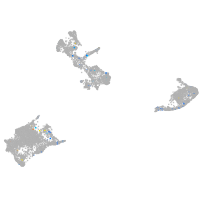
Gene expression UMAP
Display:
Expression
Stage
Other cell groups
all cells
blastomeres
PGCs
endoderm
axial mesoderm
muscle
mural cells /
non-skeletal muscle
mesenchyme
hematopoietic /
vasculature
pronephros
neural
spinal cord / glia
eye
taste / olfactory
otic / lateral line
epidermis
periderm
fin
ionocytes / mucous
pigment cells
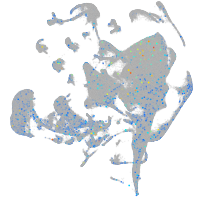
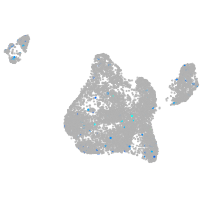
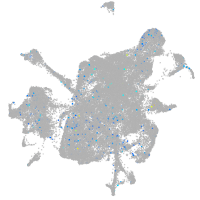
Expression by stage/cluster
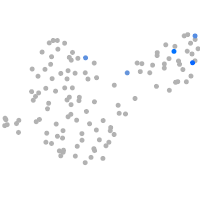
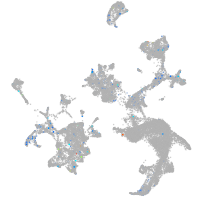
Correlated gene expression
Positive correlation
Negative correlation
Gene
r
Gene
r
btr29
0.086
si:ch211-57n23.4
-0.024
XLOC-044290
0.067
si:ch73-21g5.7
-0.023
si:ch211-282j17.12
0.067
sox11b
-0.023
BX901968.1
0.065
dlb
-0.022
LOC100333163
0.065
acvr2ba
-0.021
si:ch211-218h8.3
0.059
LOC798783
-0.020
si:ch73-7i4.2
0.057
gadd45gb.1
-0.020
CT030005.1
0.052
LOC101882472
-0.019
trim35-30
0.052
CR848812.1
-0.018
ugt5b5
0.051
ebf2
-0.018
LOC110439781
0.050
plp1a
-0.018
si:dkey-163m14.6
0.050
CR383676.1
-0.018
si:ch211-253p18.5
0.049
her13
-0.018
BX649397.1
0.049
nhlh2
-0.018
fnbp1b
0.049
ctsla
-0.017
LOC108183854
0.048
peli1b
-0.017
zgc:112183
0.048
marcksl1b
-0.017
nlrp15
0.046
cdkn1ca
-0.017
XLOC-029036
0.046
hes6
-0.017
LOC110439848
0.046
vim
-0.016
CABZ01052573.1
0.045
fabp3
-0.016
si:ch1073-272o11.3
0.045
lrrn1
-0.016
saa
0.045
meis1b
-0.016
CR848840.1
0.044
nes
-0.015
XLOC-022929
0.044
cldn19
-0.015
si:dkey-65b13.8
0.044
adam10a
-0.015
CABZ01118767.1
0.044
tp53inp2
-0.015
si:dkey-222h21.2
0.043
irs2b
-0.014
XLOC-035776
0.043
NC-002333.4
-0.014
LOC110439819
0.043
sox12
-0.014
LOC103912024
0.042
pou3f1
-0.014
znf1175
0.042
map1lc3b
-0.014
LOC100329245
0.042
znf516
-0.014
FP236810.2
0.042
elovl4a
-0.014
CU896541.1
0.042
cttnbp2nlb
-0.014