Daniocell
nab2 (blastomeres)
NGFI-A binding protein 2 (EGR1 binding protein 2)
ZFIN
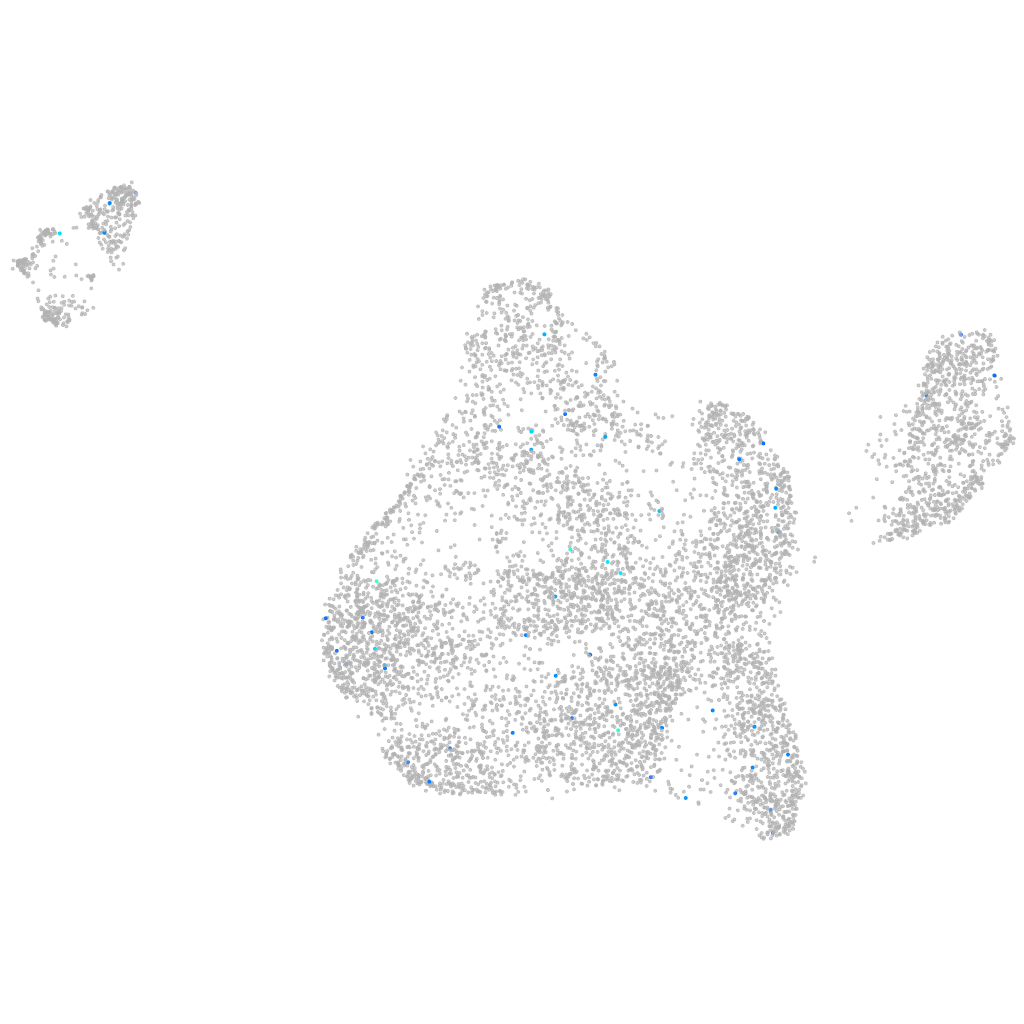
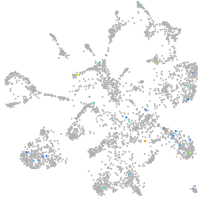
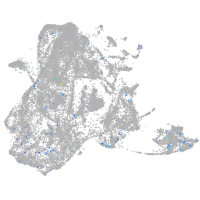
Gene expression UMAP
Display:
Expression
Stage
Other cell groups
all cells
blastomeres
PGCs
endoderm
axial mesoderm
muscle
mural cells /
non-skeletal muscle
mesenchyme
hematopoietic /
vasculature
pronephros
neural
spinal cord / glia
eye
taste / olfactory
otic / lateral line
epidermis
periderm
fin
ionocytes / mucous
pigment cells
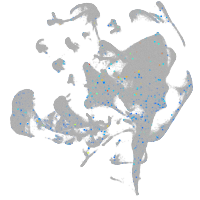
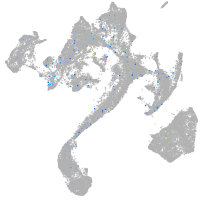
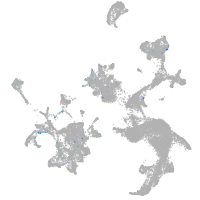
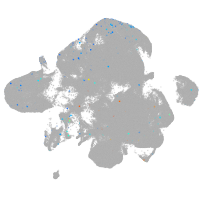
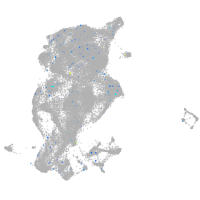
Expression by stage/cluster
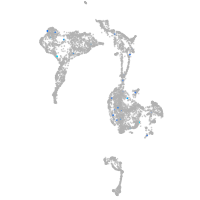
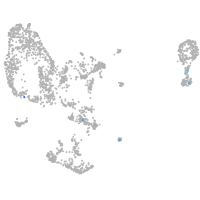
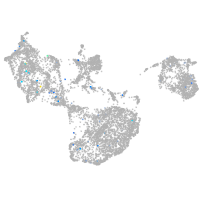
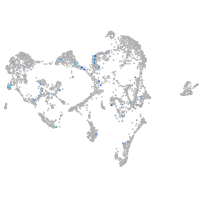
Correlated gene expression
Positive correlation
Negative correlation
Gene
r
Gene
r
CR388129.1
0.205
rbm8a
-0.033
LOC110437781
0.201
crip1
-0.030
ccdc180
0.192
rcc1
-0.030
CU929307.1
0.174
glud1b
-0.029
edil3b
0.163
hars
-0.029
grm1a
0.144
vps26b
-0.028
FP016005.1
0.143
pelo
-0.028
BX510301.2
0.140
pfdn4
-0.028
CABZ01072077.1
0.128
pdap1a
-0.027
FP067442.1
0.127
eif3i
-0.027
LOC101882317
0.123
tardbpl
-0.027
CR759845.2
0.120
cenpw
-0.026
XLOC-004796
0.119
ywhah
-0.026
CU633984.1
0.119
sdc2
-0.026
adora1b
0.117
msl1b
-0.026
AL928835.1
0.113
rgp1
-0.025
si:ch211-207j7.2
0.111
dap3
-0.025
gnb3a
0.110
eif2s3
-0.025
LOC103909783
0.110
tmprss15
-0.025
s100b
0.109
gapdh
-0.025
tbx3b
0.108
faub
-0.025
si:dkey-148a17.5
0.107
smarcc1a
-0.025
LOC110440077
0.106
khsrp
-0.024
dcc
0.104
ubl7b
-0.024
LOC100535550
0.104
BX470189.1
-0.024
LOC103909664
0.104
c2cd2
-0.024
si:dkey-111f13.5
0.103
tmem176l.1
-0.024
c15h3orf80
0.102
tgfbrap1
-0.024
mmel1
0.101
zgc:103508
-0.024
zgc:103755
0.101
pycr1b
-0.024
grhprb
0.101
tp53rk
-0.023
gdpd4b
0.100
mrpl9
-0.023
phldb1a
0.099
sp5l
-0.023
si:dkey-56f14.7
0.098
pcf11
-0.023
cx35.4
0.098
uchl1
-0.023