Daniocell
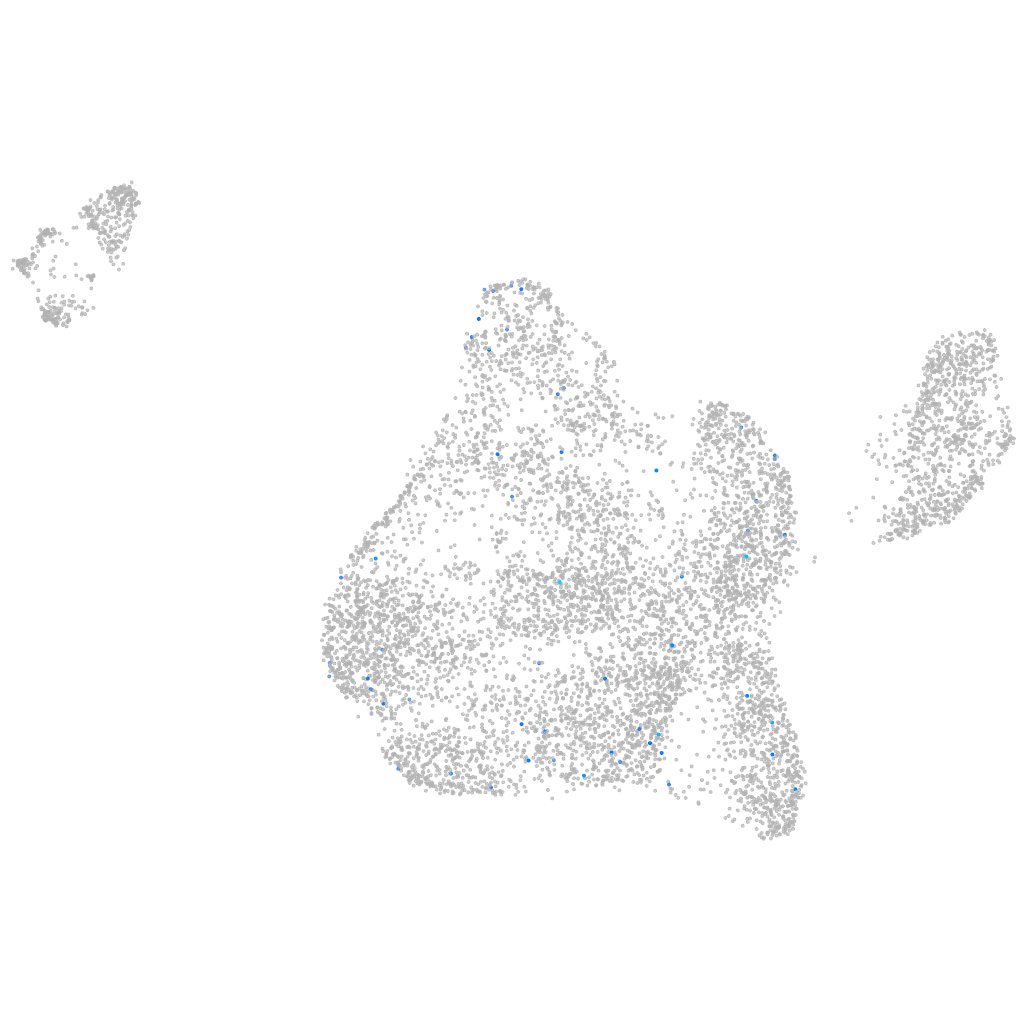
myo10l3 (blastomeres)
"myosin X, like 3"
ZFIN
Gene expression UMAP
Display:
Expression
Stage
Other cell groups
all cells
blastomeres
PGCs
endoderm
axial mesoderm
muscle
mural cells /
non-skeletal muscle
mesenchyme
hematopoietic /
vasculature
pronephros
neural
spinal cord / glia
eye
taste / olfactory
otic / lateral line
epidermis
periderm
fin
ionocytes / mucous
pigment cells
Expression by stage/cluster
Correlated gene expression
Positive correlation
Negative correlation
Gene
r
Gene
r
LOC110440141
0.194
psme3
-0.032
XLOC-010723
0.182
CR450793.1
-0.032
pdzrn3a
0.171
noto
-0.031
CR847983.1
0.170
inka1a
-0.030
BX000451.1
0.165
tmem106a
-0.029
slc6a15
0.159
ppdpfb
-0.028
XLOC-025107
0.157
ucp2
-0.028
ada
0.147
cpvl
-0.027
LOC101882375
0.145
ppifb
-0.027
si:ch211-196g2.4
0.142
spink2.1
-0.027
LOC108179157
0.142
mid1ip1a
-0.026
LOC103908867
0.140
stx5a
-0.026
qkib
0.133
cnot8
-0.026
si:busm1-104n07.3
0.133
cry2
-0.025
nxnl1
0.123
cldn7b
-0.025
si:ch211-66h3.4
0.120
ska1
-0.025
oprd1a
0.119
eaf1
-0.025
mc2r
0.118
hars
-0.025
LOC570079
0.117
rps6ka3a
-0.025
zgc:174259
0.115
mcm3l
-0.025
cxcl11.6
0.115
cuedc2
-0.025
BX294110.1
0.112
sucla2
-0.024
zgc:153704
0.109
dtnbp1a
-0.024
tgfb1b
0.109
zgc:55461
-0.024
LOC100329245
0.108
zp3.2
-0.024
CT574585.2
0.106
rap2c
-0.024
VSTM2B
0.104
desi2
-0.024
gngt2a
0.104
si:ch73-299h12.2
-0.024
LOC101884976
0.103
chtopb
-0.024
rubcnl
0.102
cnot2
-0.024
BX248410.1
0.099
rpia
-0.024
nptxra
0.099
si:ch211-14a17.7
-0.024
slc22a6l
0.099
klhl18
-0.023
XLOC-034498
0.099
ddx3xa
-0.023
CU633478.1
0.097
rcor1
-0.023