Daniocell
mtus1b (taste / olfactory)
microtubule associated tumor suppressor 1b
ZFIN
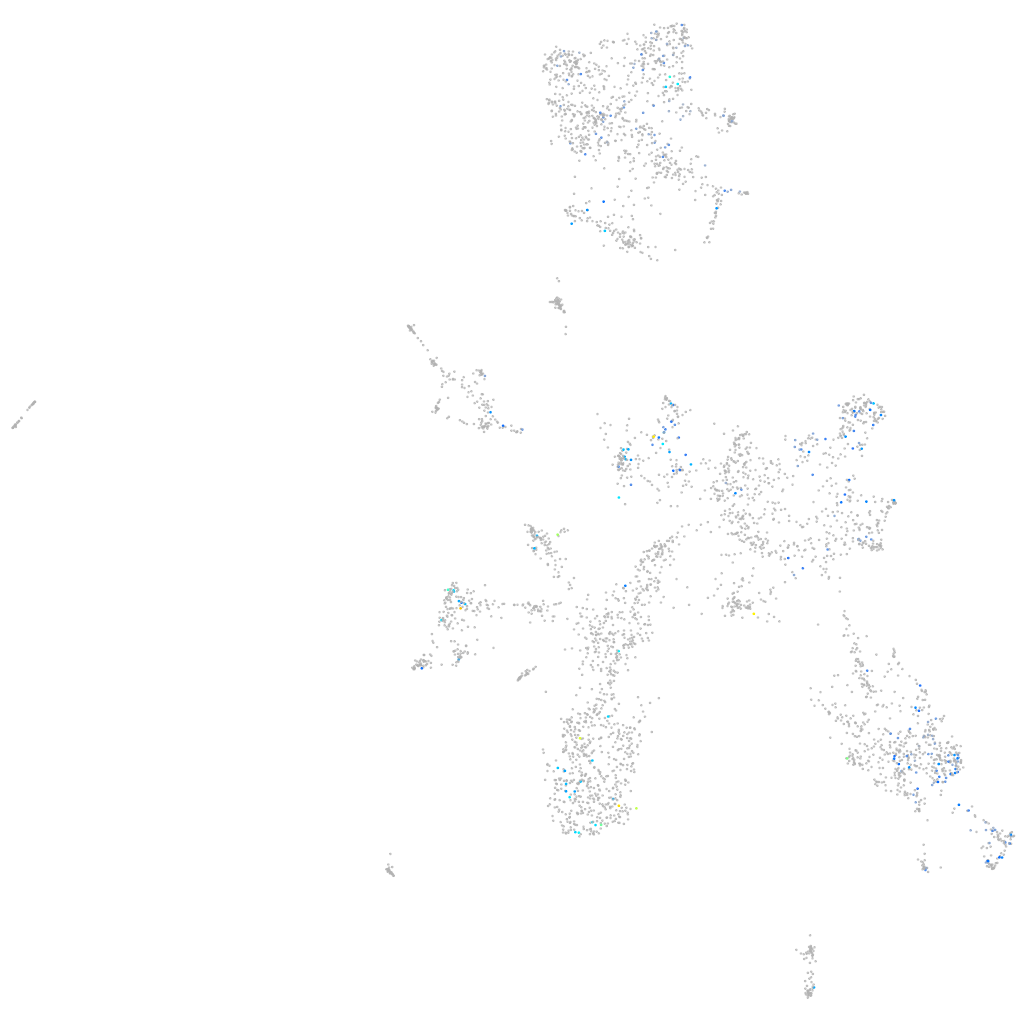
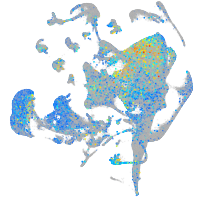
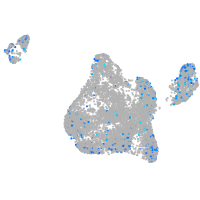
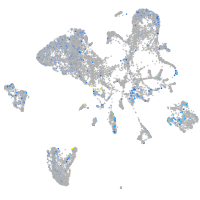
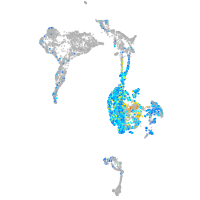
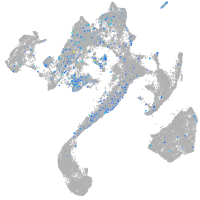
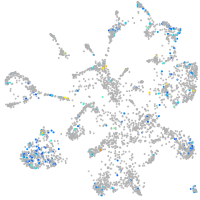
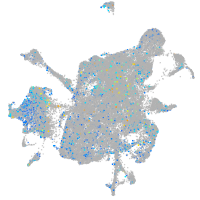
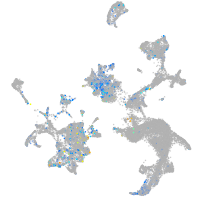
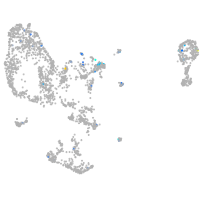
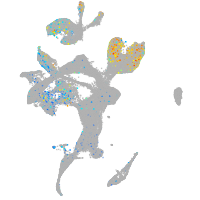
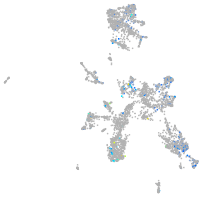
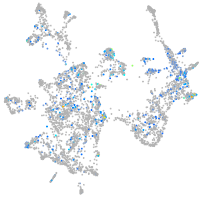
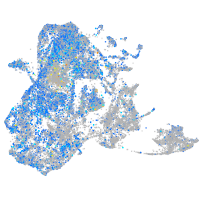
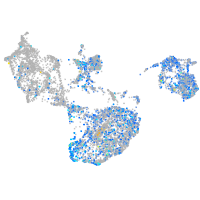
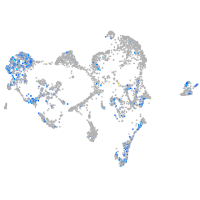
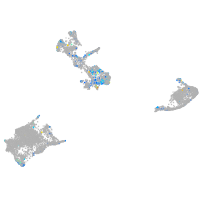
Gene expression UMAP
Display:
Expression
Stage
Other cell groups
all cells
blastomeres
PGCs
endoderm
axial mesoderm
muscle
mural cells /
non-skeletal muscle
mesenchyme
hematopoietic /
vasculature
pronephros
neural
spinal cord / glia
eye
taste / olfactory
otic / lateral line
epidermis
periderm
fin
ionocytes / mucous
pigment cells
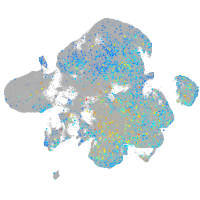
Expression by stage/cluster
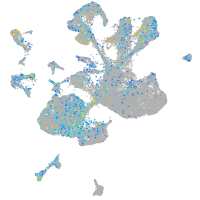
Correlated gene expression
Positive correlation
Negative correlation
Gene
r
Gene
r
mfsd2b
0.187
cirbpa
-0.084
fam160a1b
0.160
si:ch211-222l21.1
-0.072
BX640453.1
0.156
ywhaz
-0.071
ush1gb
0.148
chd4b
-0.067
BX957326.1
0.148
eef2b
-0.060
AL954146.1
0.147
pvalb8
-0.060
CR589882.1
0.147
tuba8l3
-0.059
gabrb3
0.147
arf5
-0.056
LOC100535225
0.147
h3f3d
-0.055
crygm2f
0.142
fam32a
-0.055
taar19i
0.142
hsp90ab1
-0.055
si:dkeyp-35e5.5
0.141
h2afvb
-0.055
BX465849.1
0.141
ube2e1
-0.055
LOC110439324
0.140
lsm5
-0.054
cplx4a
0.139
rpl22
-0.054
LOC103908679
0.137
pfn2l
-0.054
lactbl1b
0.132
BX284638.1
-0.054
si:ch211-1f22.1
0.130
hmga1a
-0.053
ccdc87
0.130
blcap
-0.053
oprd1b
0.130
rps12
-0.053
ccl35.1
0.129
cldn7b
-0.053
LOC110440005
0.129
mapkapk2a
-0.053
znf1017
0.129
hnrnpl
-0.053
bicd1a
0.129
serbp1a
-0.051
cmklr1
0.128
dlb
-0.051
calb2b
0.125
neurod1
-0.051
si:dkey-19b23.10
0.123
ran
-0.051
znf1128
0.122
ptmab
-0.051
nrxn3b
0.122
srrm4
-0.050
LOC110438742
0.121
snrpb
-0.050
si:dkey-191j3.2
0.121
actl6a
-0.050
si:ch73-256g18.2
0.119
rtca
-0.050
cacna1sa
0.118
si:ch211-288g17.3
-0.049
CR407585.1
0.117
uck2a
-0.049
gas2a
0.117
zgc:56304
-0.049