Daniocell
mtg2 (pigment cells)
mitochondrial ribosome-associated GTPase 2
ZFIN
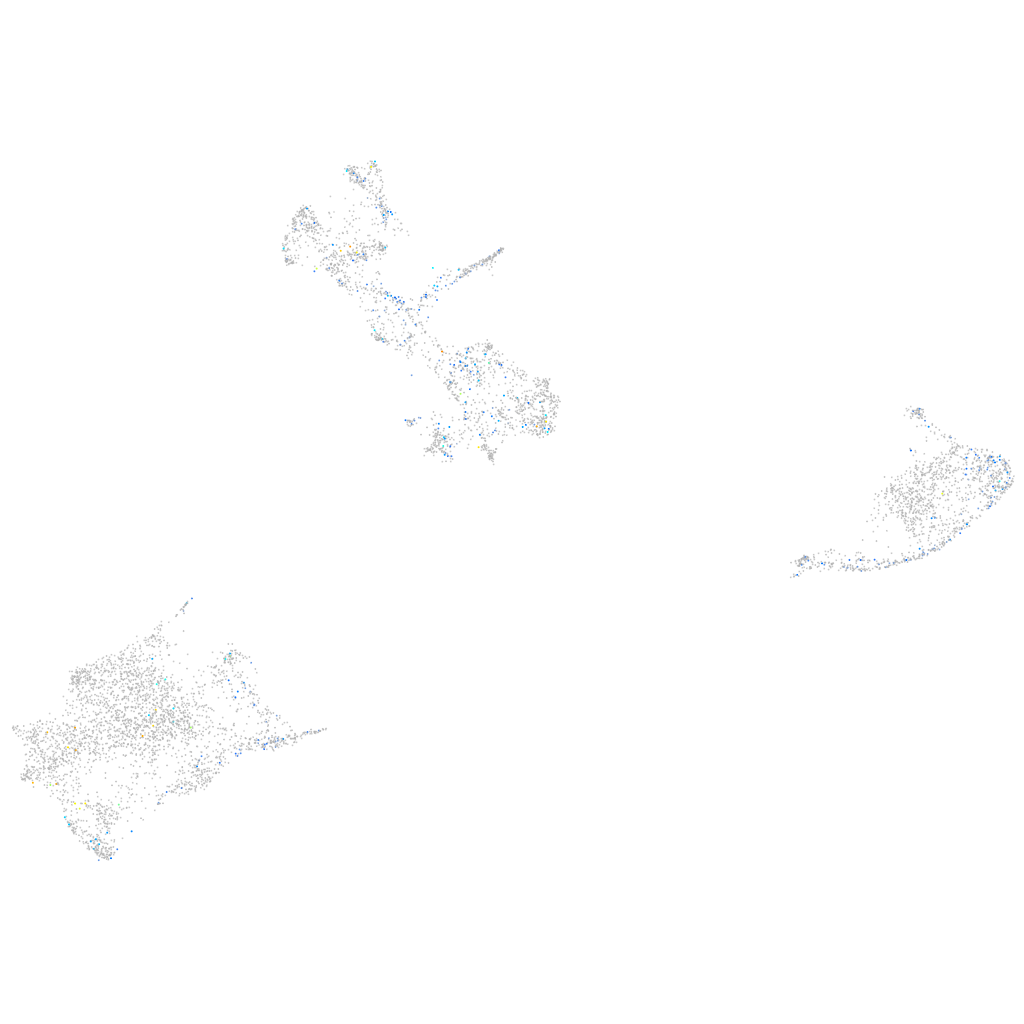
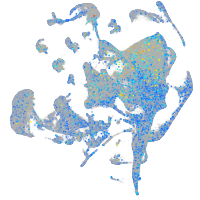
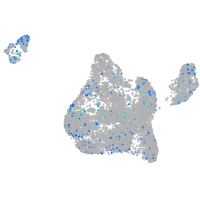
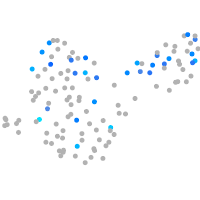
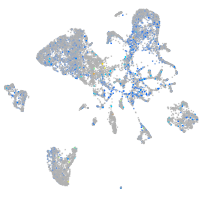
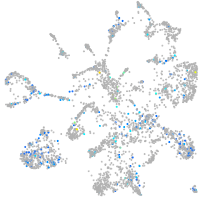
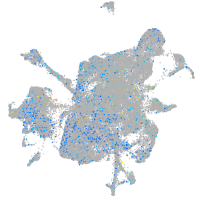
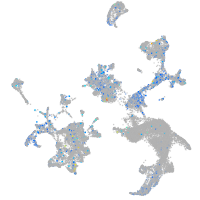
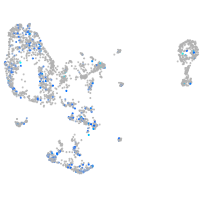
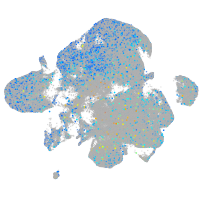
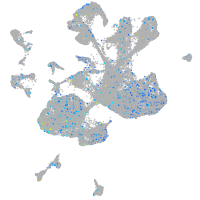
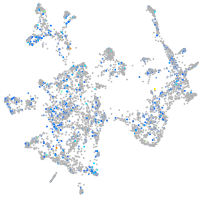
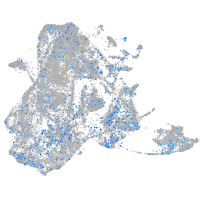
Gene expression UMAP
Display:
Expression
Stage
Other cell groups
all cells
blastomeres
PGCs
endoderm
axial mesoderm
muscle
mural cells /
non-skeletal muscle
mesenchyme
hematopoietic /
vasculature
pronephros
neural
spinal cord / glia
eye
taste / olfactory
otic / lateral line
epidermis
periderm
fin
ionocytes / mucous
pigment cells
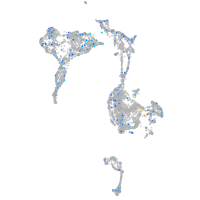
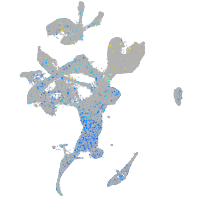
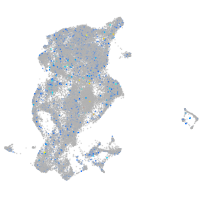
Expression by stage/cluster
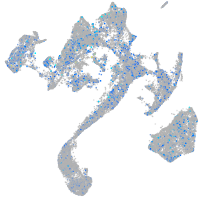
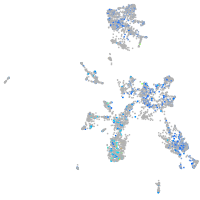
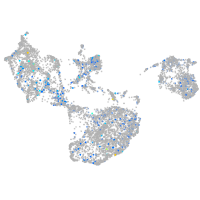
Correlated gene expression
Positive correlation
Negative correlation
Gene
r
Gene
r
si:dkey-236e20.3
0.167
gch2
-0.070
XLOC-038745
0.162
gstp1
-0.059
BX855614.2
0.153
CABZ01021592.1
-0.057
si:dkey-83m22.7
0.144
si:dkey-251i10.2
-0.056
npffr2b
0.140
akr1b1
-0.052
psmb9a
0.140
hbae1.1
-0.049
pax1a
0.135
hbae3
-0.046
gga3b
0.125
pts
-0.044
XLOC-037017
0.123
marcksl1b
-0.044
LOC101884676
0.116
hbbe1.3
-0.042
XLOC-024828
0.116
uraha
-0.041
XLOC-015260
0.113
tmem130
-0.041
BX901922.1
0.111
zgc:110339
-0.040
LOC101882465
0.111
cyt1
-0.040
NC-002333.13
0.110
bco1
-0.038
ihhb
0.110
si:dkey-126g1.9
-0.037
gpr158b
0.109
si:dkey-73n8.3
-0.037
CU467646.6
0.108
hbbe1.2
-0.036
gpr185a
0.108
TMEM19
-0.035
lrguk
0.108
slc22a7a
-0.034
XLOC-007007
0.107
gpd1b
-0.034
exorh
0.107
mdh1aa
-0.034
casc1
0.107
prdx1
-0.034
nptx2a
0.104
sult1st1
-0.031
si:ch211-255i20.3
0.103
rbp4l
-0.029
timp4.3
0.103
cd63
-0.029
ankrd45
0.102
cyt1l
-0.029
LOC108179500
0.101
aox5
-0.028
cobl
0.101
cyb5a
-0.028
zgc:195023
0.101
zgc:153031
-0.027
RF00566
0.101
hbbe1.1
-0.027
BX005124.1
0.100
rab27a
-0.026
hhat
0.099
oxr1b
-0.025
si:ch211-67f24.7
0.099
palm1a
-0.025
CR385077.1
0.098
paics
-0.025