Daniocell
morc3a (pigment cells)
MORC family CW-type zinc finger 3a
ZFIN
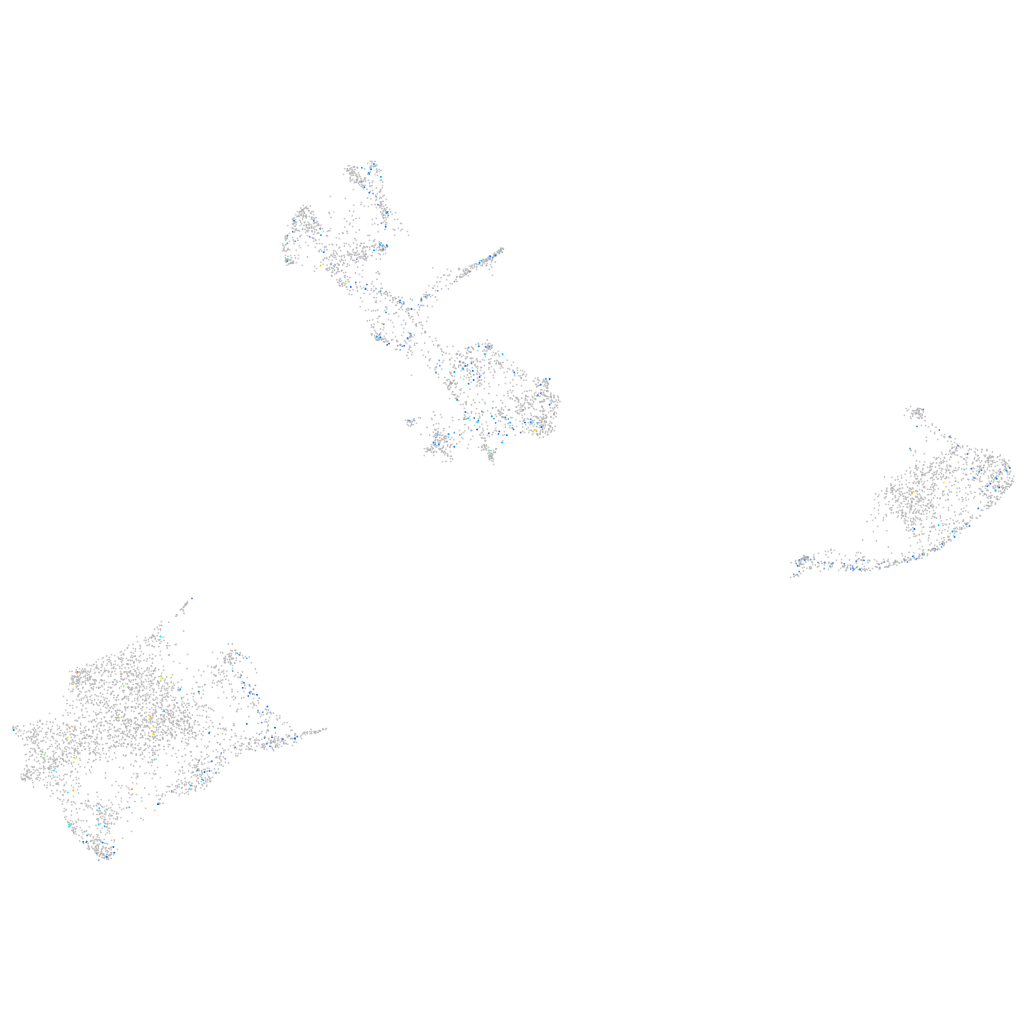
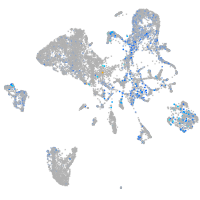
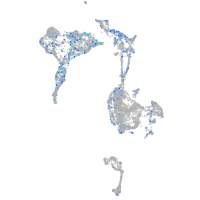
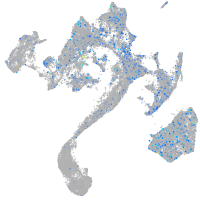
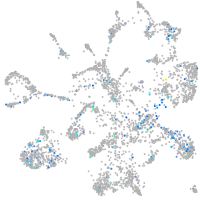
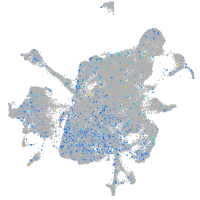
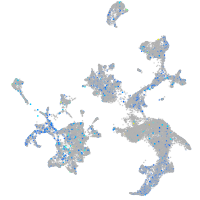
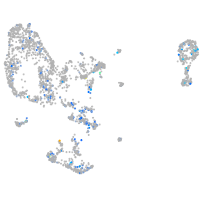
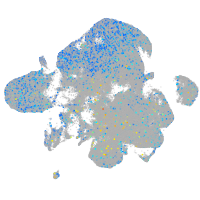
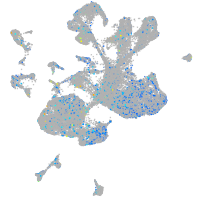
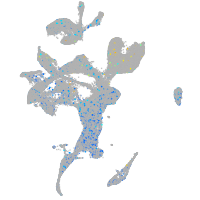
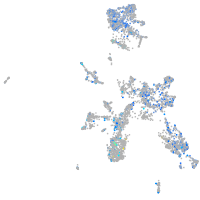
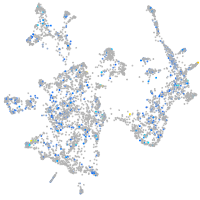
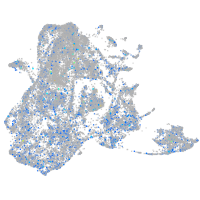
Gene expression UMAP
Display:
Expression
Stage
Other cell groups
all cells
blastomeres
PGCs
endoderm
axial mesoderm
muscle
mural cells /
non-skeletal muscle
mesenchyme
hematopoietic /
vasculature
pronephros
neural
spinal cord / glia
eye
taste / olfactory
otic / lateral line
epidermis
periderm
fin
ionocytes / mucous
pigment cells
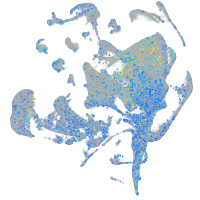
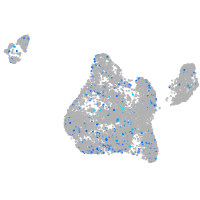
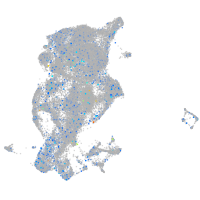
Expression by stage/cluster
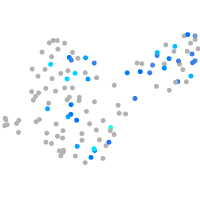
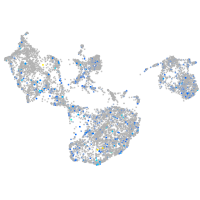
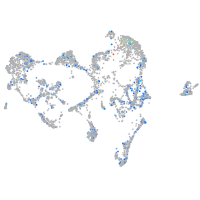
Correlated gene expression
Positive correlation
Negative correlation
Gene
r
Gene
r
LOC110438930
0.157
gstp1
-0.051
LOC100538032.1
0.150
gch2
-0.044
XRCC2
0.135
prdx1
-0.043
CR936416.1
0.128
CABZ01021592.1
-0.037
XLOC-043685
0.126
paics
-0.034
si:ch73-194h10.2
0.124
zgc:110339
-0.034
snx18b
0.117
si:dkey-251i10.2
-0.034
CR848715.1
0.112
cyt1l
-0.033
LOC101887106
0.109
cyb5a
-0.031
cnr1
0.108
si:dkey-204f11.64
-0.030
si:ch211-67f24.7
0.106
pvalb2
-0.030
jac1
0.105
pts
-0.030
LOC110438594
0.104
akr1b1
-0.029
ahsg1
0.102
cyt1
-0.029
si:ch211-127b6.2
0.101
tmem130
-0.029
atf6b
0.100
oacyl
-0.028
pnn
0.098
bscl2l
-0.028
LOC100330501
0.097
uraha
-0.027
si:dkeyp-80d11.4
0.096
sult1st1
-0.027
uts2a
0.096
mylpfa
-0.027
grxcr1a
0.095
hbbe1.3
-0.026
kcnh5b
0.092
krt4
-0.026
si:ch211-194p6.10
0.092
tnni2a.4
-0.025
epor
0.092
pvalb1
-0.024
FO904901.1
0.092
rpl36a
-0.024
CR377211.1
0.090
actc1b
-0.023
otol1a
0.090
cyb561a3b
-0.023
tcf19l
0.089
si:dkey-73n8.3
-0.023
CABZ01071845.1
0.088
tcnbb
-0.022
ppm1na
0.087
si:dkey-151g10.6
-0.021
crhr2
0.087
myl1
-0.021
ptrh1
0.087
icn
-0.021
LOC101882805
0.087
tnnc1b
-0.021
trim35-28
0.087
fabp2
-0.021
LOC100537853
0.087
slc22a7a
-0.021