Daniocell
mkks (blastomeres)
McKusick-Kaufman syndrome
ZFIN
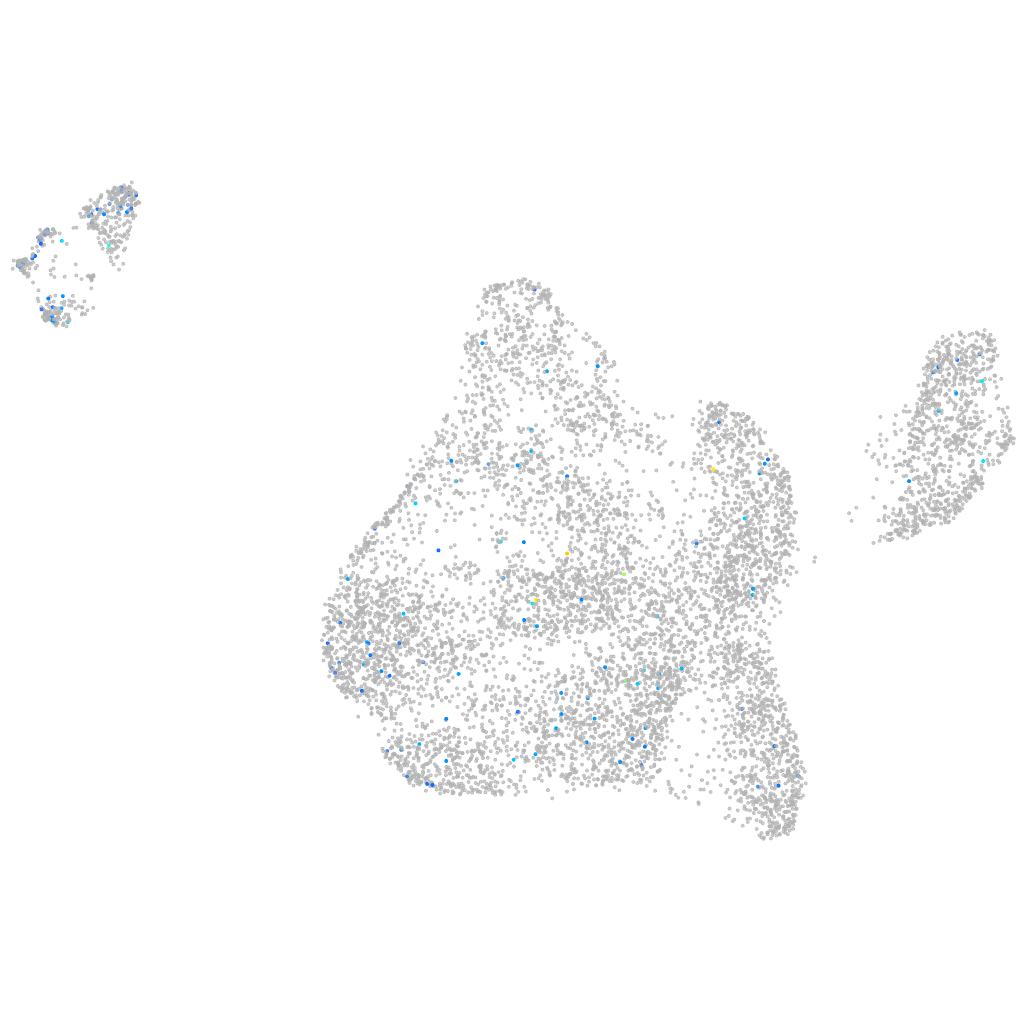
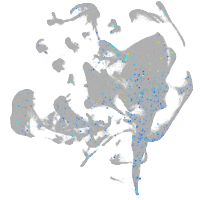
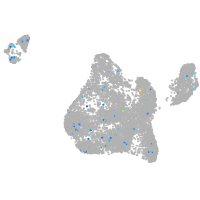
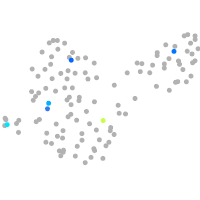
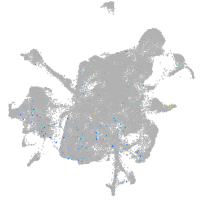
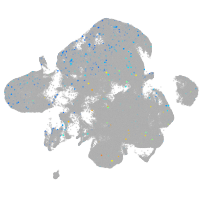
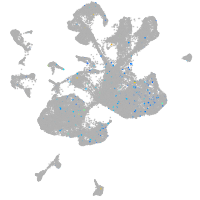
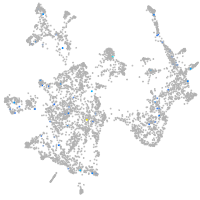
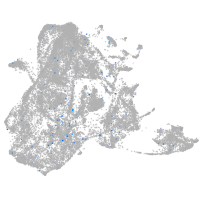
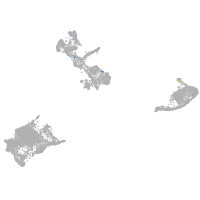
Gene expression UMAP
Display:
Expression
Stage
Other cell groups
all cells
blastomeres
PGCs
endoderm
axial mesoderm
muscle
mural cells /
non-skeletal muscle
mesenchyme
hematopoietic /
vasculature
pronephros
neural
spinal cord / glia
eye
taste / olfactory
otic / lateral line
epidermis
periderm
fin
ionocytes / mucous
pigment cells
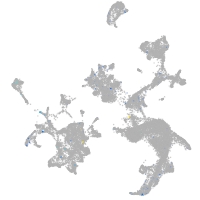
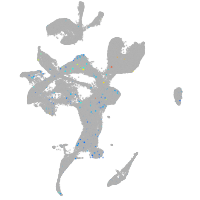
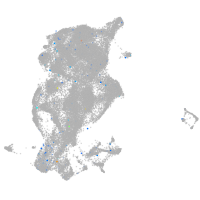
Expression by stage/cluster
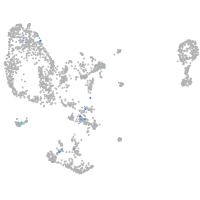
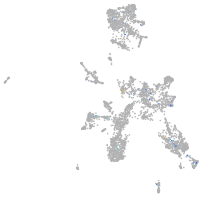
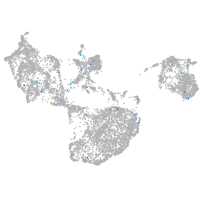
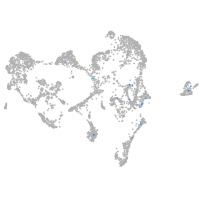
Correlated gene expression
Positive correlation
Negative correlation
Gene
r
Gene
r
fybb
0.126
stm
-0.090
tspearb
0.121
marcksl1b
-0.089
tmem38a
0.119
si:dkey-151g10.6
-0.083
vav3
0.111
hnrnpa0b
-0.081
zmynd10
0.107
si:ch73-1a9.3
-0.075
FO904898.1
0.104
rpl26
-0.073
ccl38.1
0.104
tbx16
-0.067
CR391991.5
0.104
hmga1a
-0.066
si:ch211-157b11.8
0.103
rps19
-0.064
rdh8b
0.103
dynll1
-0.062
BX908750.2
0.102
akap12b
-0.060
CU929073.1
0.102
rps20
-0.059
chrna2b
0.102
si:dkey-56m19.5
-0.058
CU278559.1
0.101
rps12
-0.055
CABZ01020455.1
0.098
rpl23a
-0.055
capga
0.098
si:ch211-152c2.3
-0.054
map1sa
0.098
rpl39
-0.053
sik1
0.096
hspb1
-0.052
RF01277
0.096
rps16
-0.052
si:dkey-11e23.9
0.093
hmgb2a
-0.051
BX005376.1
0.092
ccnd1
-0.050
LOC101886700
0.092
rps4x
-0.050
XLOC-034199
0.091
hmgn6
-0.050
pou3f2b
0.091
rplp1
-0.049
CABZ01044048.1
0.090
ved
-0.049
ugt5a2
0.088
ddx5
-0.048
aldh1a3
0.086
ybx1
-0.047
LOC103911920
0.086
ptmab
-0.046
si:ch211-137a8.2
0.086
eef1a1l1
-0.046
cables2a
0.086
lrwd1
-0.046
si:ch211-201o1.1
0.086
snrpf
-0.046
cdca9
0.085
srsf5a
-0.046
gltpd2
0.084
rpl29
-0.045
timp4.1
0.084
mcm3
-0.044
cacng5a
0.084
rps28
-0.044