Daniocell
mfsd13a (pigment cells)
major facilitator superfamily domain containing 13A
ZFIN
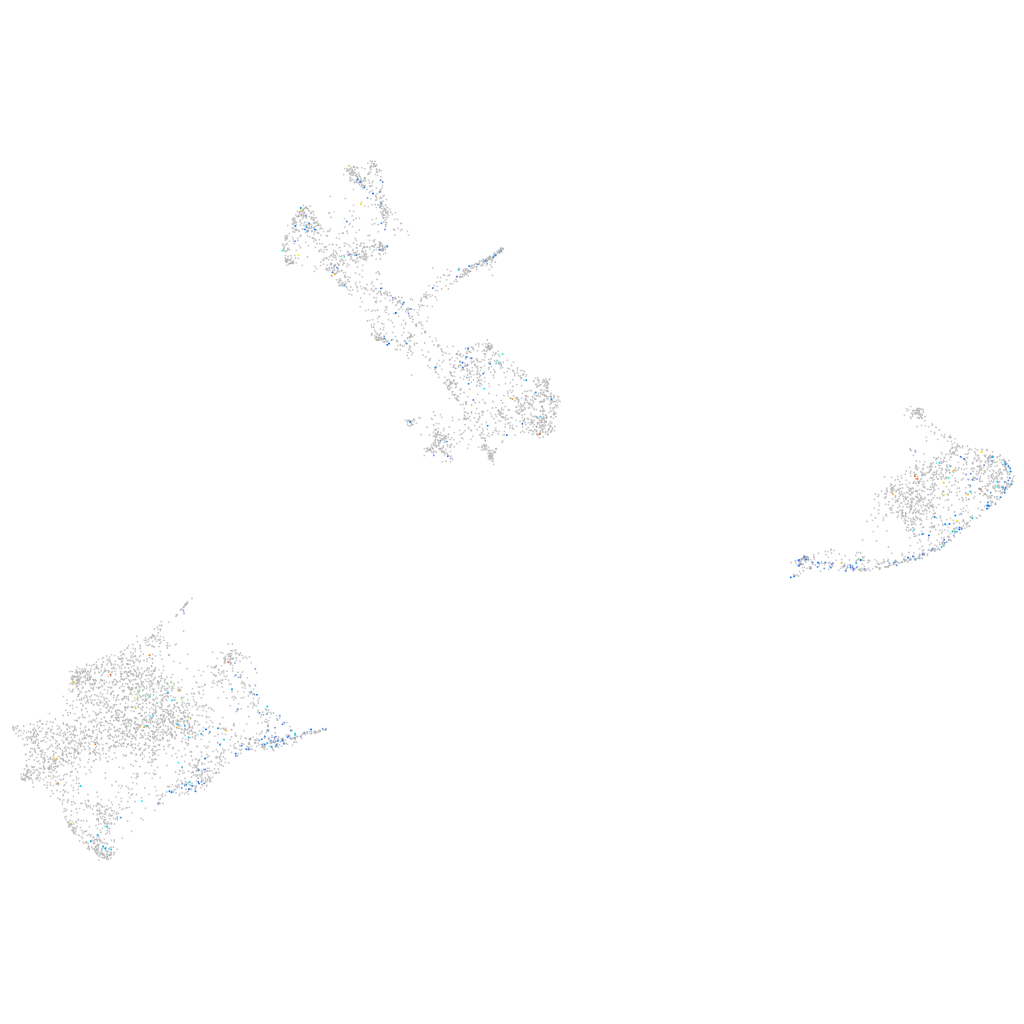
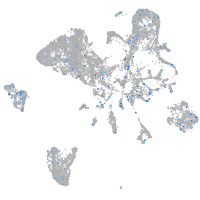
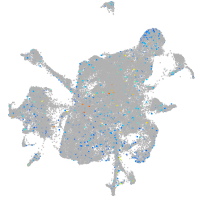
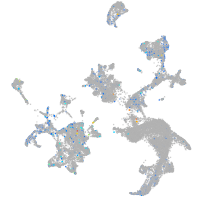
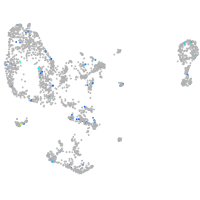
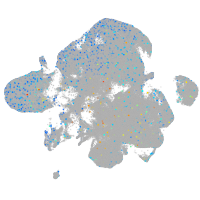
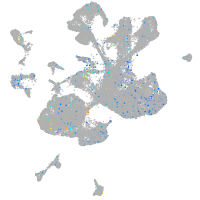
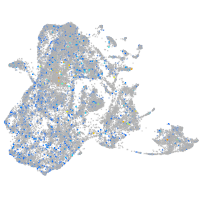
Gene expression UMAP
Display:
Expression
Stage
Other cell groups
all cells
blastomeres
PGCs
endoderm
axial mesoderm
muscle
mural cells /
non-skeletal muscle
mesenchyme
hematopoietic /
vasculature
pronephros
neural
spinal cord / glia
eye
taste / olfactory
otic / lateral line
epidermis
periderm
fin
ionocytes / mucous
pigment cells
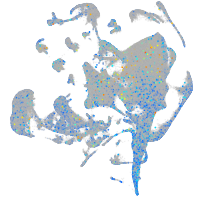
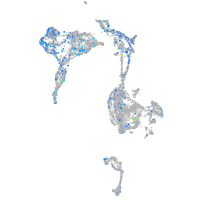
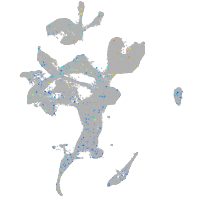
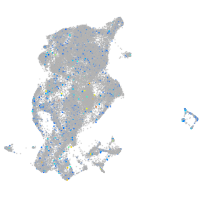
Expression by stage/cluster
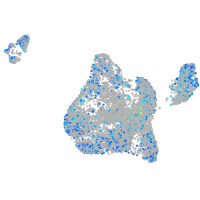
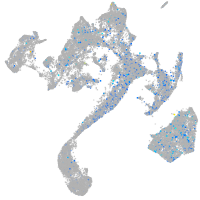
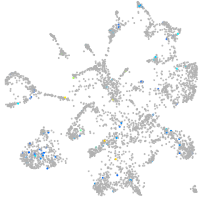
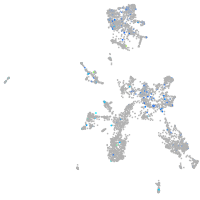
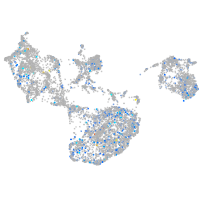
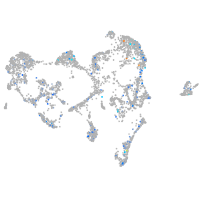
Correlated gene expression
Positive correlation
Negative correlation
Gene
r
Gene
r
kcnk3b
0.143
pvalb2
-0.052
si:ch211-13f8.2
0.138
actc1b
-0.051
CT025776.2
0.129
pvalb1
-0.051
zgc:171490
0.127
mylpfa
-0.049
LOC110437941
0.114
krt4
-0.048
LOC101885444
0.106
tnnt3b
-0.047
LOC100330866
0.105
ptmaa
-0.043
pcdh2ab12
0.104
si:dkey-251i10.2
-0.042
LOC103911035
0.104
uraha
-0.042
kcnh3
0.104
zgc:110339
-0.042
cd164l2
0.100
hbbe1.1
-0.039
c8b
0.099
mylpfb
-0.038
CAPN14
0.097
krt8
-0.038
zgc:195245
0.096
tnni2a.4
-0.037
ifit16
0.095
mdh1aa
-0.035
cfap52
0.094
tmsb
-0.034
LOC101882590
0.093
tmsb2
-0.034
XLOC-019042
0.093
fabp7a
-0.034
si:ch211-155m12.1
0.093
aqp3a
-0.033
faah2b
0.090
CELA1 (1 of many)
-0.033
SPAG9
0.090
stmn1b
-0.033
BX469925.3
0.090
gpm6aa
-0.032
si:dkey-27j5.8
0.087
col1a2
-0.032
CABZ01101813.1
0.087
CABZ01021592.1
-0.031
mcf2l2
0.086
prss59.2
-0.031
LOC100149223
0.086
ttn.2
-0.031
LOC103912045
0.084
cd9a
-0.031
slc37a2
0.084
ndrg2
-0.031
CR769777.1
0.084
si:dkey-183i3.5
-0.030
rom1a
0.084
tpma
-0.030
clec3bb
0.084
krtt1c19e
-0.030
arhgef1a
0.084
nme2b.2
-0.030
col5a3b
0.083
apoa2
-0.030
lrp2b
0.083
rplp0
-0.029
XLOC-038019
0.082
krt91
-0.029