Daniocell
med14 (pigment cells)
mediator complex subunit 14
ZFIN
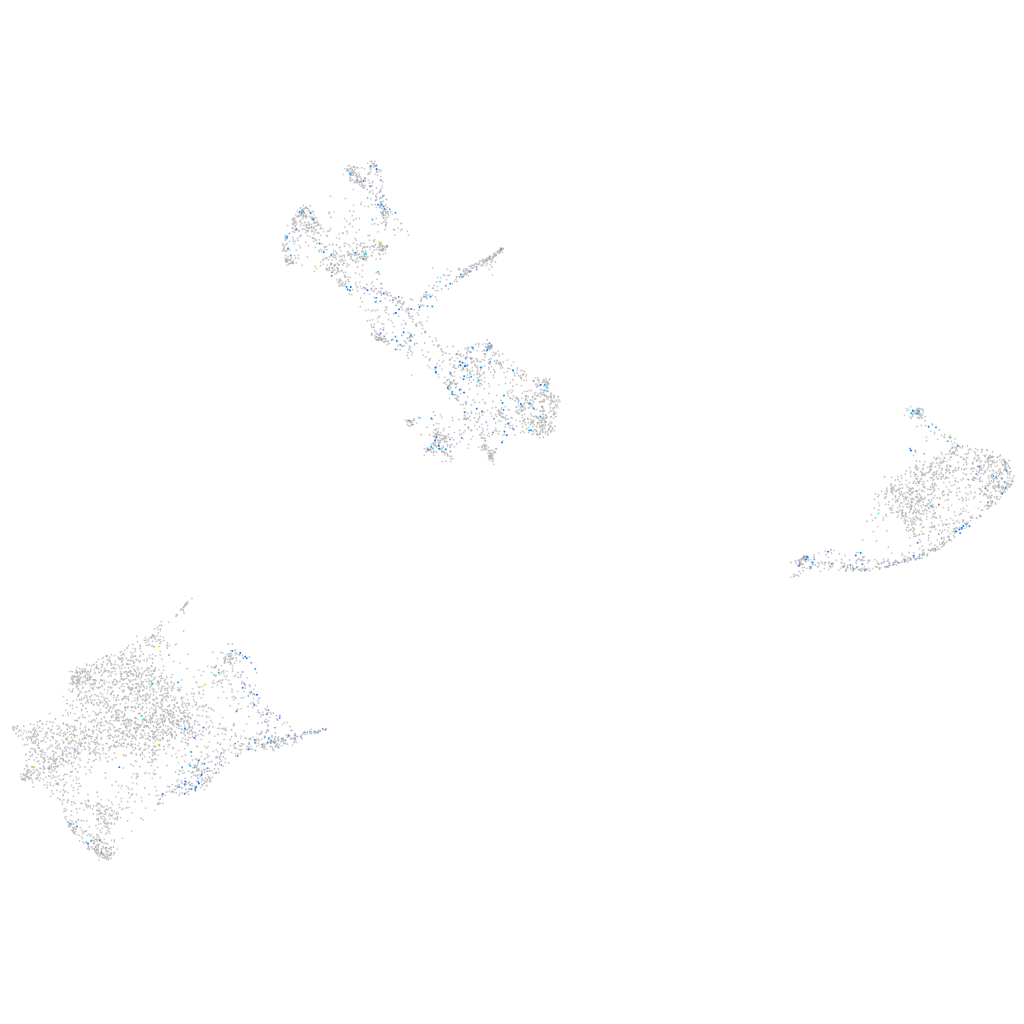
Gene expression UMAP
Display:
Expression
Stage
Other cell groups
all cells
blastomeres
PGCs
endoderm
axial mesoderm
muscle
mural cells /
non-skeletal muscle
mesenchyme
hematopoietic /
vasculature
pronephros
neural
spinal cord / glia
eye
taste / olfactory
otic / lateral line
epidermis
periderm
fin
ionocytes / mucous
pigment cells
Expression by stage/cluster
Correlated gene expression
Positive correlation
Negative correlation
Gene
r
Gene
r
XLOC-043043
0.187
zgc:110339
-0.068
si:ch211-207e19.2
0.184
pvalb1
-0.067
BX942846.1
0.140
gstp1
-0.062
FP067442.1
0.134
si:dkey-251i10.2
-0.057
snrpb
0.116
pvalb2
-0.057
XLOC-029426
0.112
gch2
-0.056
FP102192.1
0.106
slc22a7a
-0.056
LOC101882320
0.106
CABZ01021592.1
-0.054
CU633855.1
0.106
actc1b
-0.054
si:ch211-222f23.6
0.106
mylz3
-0.053
syncrip
0.103
icn
-0.052
ddx39ab
0.103
cyt1
-0.052
XLOC-031035
0.100
tmsb4x
-0.050
PITPNC1
0.099
s100a10b
-0.049
XLOC-014146
0.098
tnnt3b
-0.048
gdnfb
0.097
tpma
-0.044
CABZ01003344.1
0.097
uraha
-0.044
h2afvb
0.095
mylpfa
-0.044
LOC110438154
0.095
tnni2a.4
-0.043
znf1025
0.095
cd63
-0.043
hdgfl2
0.094
hbae3
-0.041
snrpf
0.093
aqp3a
-0.040
hnrnpa0b
0.093
hbae1.1
-0.040
si:ch1073-155h21.2
0.093
hbbe1.3
-0.039
foxi1
0.092
ckmb
-0.036
setb
0.091
krt18b
-0.036
pex11a
0.091
ttn.1
-0.036
hmgb2b
0.090
actb2
-0.036
cbx3a
0.089
uchl1
-0.036
CABZ01038524.1
0.089
rtn1b
-0.035
RF00009
0.089
aldh9a1a.1
-0.035
ddx39aa
0.088
bscl2l
-0.035
AL929457.1
0.088
krt4
-0.034
srsf5a
0.087
ckma
-0.034
XLOC-015424
0.087
csrp2
-0.033