Daniocell
mboat2a (blastomeres)
membrane bound O-acyltransferase domain containing 2a
ZFIN
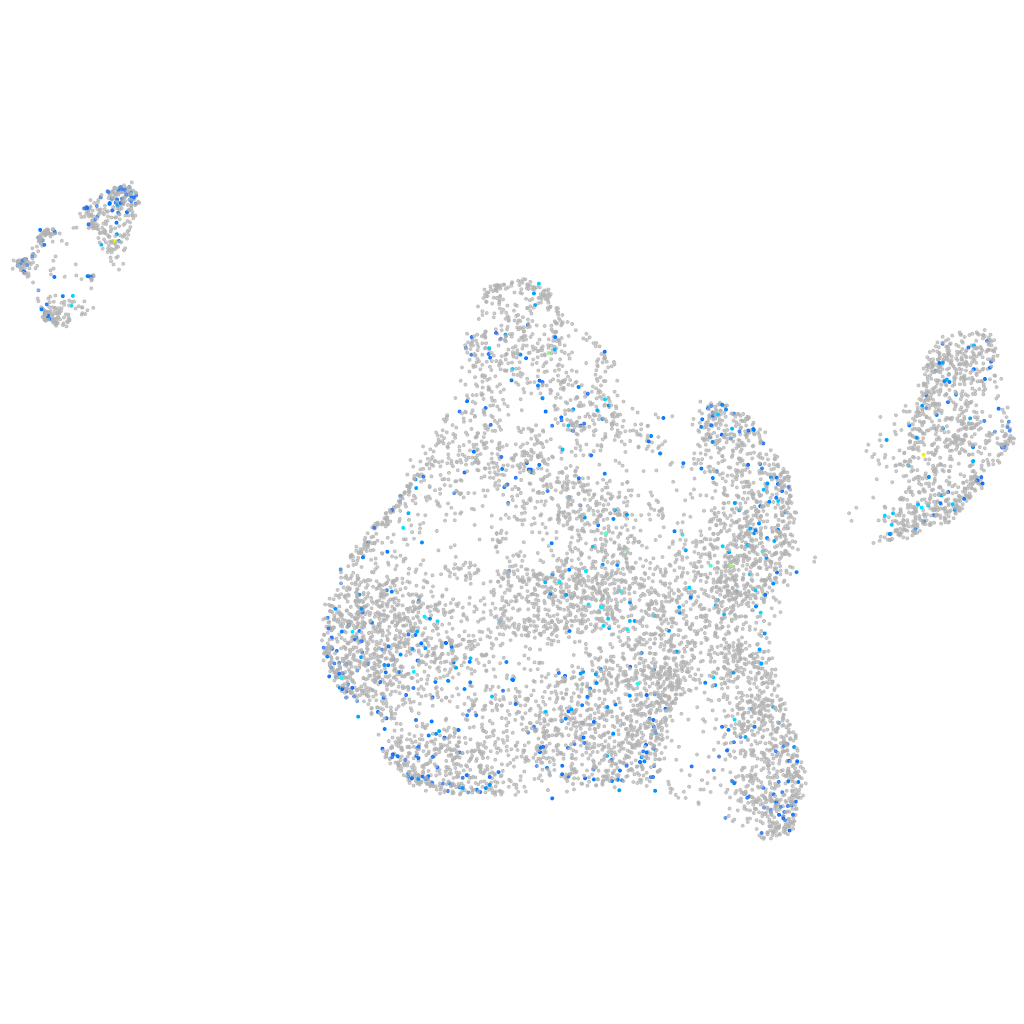
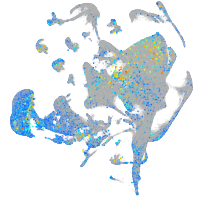
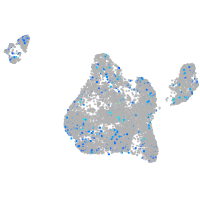
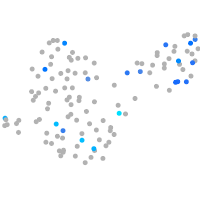
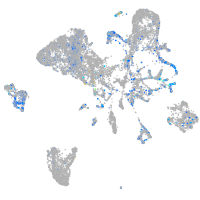
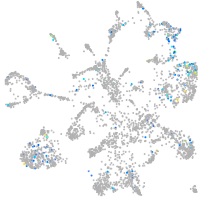
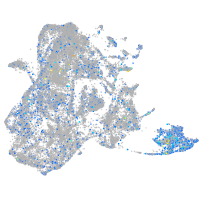
Gene expression UMAP
Display:
Expression
Stage
Other cell groups
all cells
blastomeres
PGCs
endoderm
axial mesoderm
muscle
mural cells /
non-skeletal muscle
mesenchyme
hematopoietic /
vasculature
pronephros
neural
spinal cord / glia
eye
taste / olfactory
otic / lateral line
epidermis
periderm
fin
ionocytes / mucous
pigment cells
Expression by stage/cluster
Correlated gene expression
Positive correlation
Negative correlation
Gene
r
Gene
r
cyp1a
0.079
hspb1
-0.051
LOC110438080
0.078
eef1a1l1
-0.046
LOC100330380
0.077
marcksl1b
-0.044
si:ch211-165f21.7
0.077
dynll1
-0.041
LOC108179500
0.075
hmga1a
-0.039
or131-2
0.075
ptgdsb.1
-0.038
XLOC-016788
0.075
si:ch211-152c2.3
-0.038
CABZ01086755.1
0.074
hmgb2b
-0.037
larp6b
0.073
hmgb2a
-0.037
LOC101883855
0.070
hmgn6
-0.035
si:ch211-173n18.3
0.068
psmb7
-0.032
gprc5ba
0.063
calm2b
-0.032
fam228a
0.063
rpl32
-0.032
mylkb
0.063
stim2a
-0.032
BX908744.2
0.062
hmgn2
-0.032
XLOC-019030
0.062
ptmab
-0.032
LOC100005723
0.062
NC-002333.4
-0.031
nampta
0.061
tmem35
-0.031
mir430a-13
0.059
serpinh1b
-0.031
BX649421.1
0.059
rps28
-0.030
irgf1
0.057
si:ch73-1a9.3
-0.030
ppp1r3b
0.057
angptl4
-0.030
edaradd
0.057
rpl26
-0.030
XLOC-019859
0.057
aldob
-0.030
BX284666.2
0.057
rpl39
-0.029
pik3r3b
0.057
h3f3d
-0.029
map1lc3c
0.057
hnrnpa0b
-0.029
fut7
0.056
srsf5a
-0.029
ctxn3
0.056
prelid1b
-0.029
zgc:123297
0.056
h2afvb
-0.028
cnrip1a
0.055
rps12
-0.028
zgc:194114
0.055
si:ch211-222l21.1
-0.028
hyou1
0.055
ddx61
-0.028
r3hdm1
0.055
stm
-0.028
slc43a3b
0.055
si:ch73-335l21.4
-0.028