Daniocell
mbip (blastomeres)
MAP3K12 binding inhibitory protein 1
ZFIN
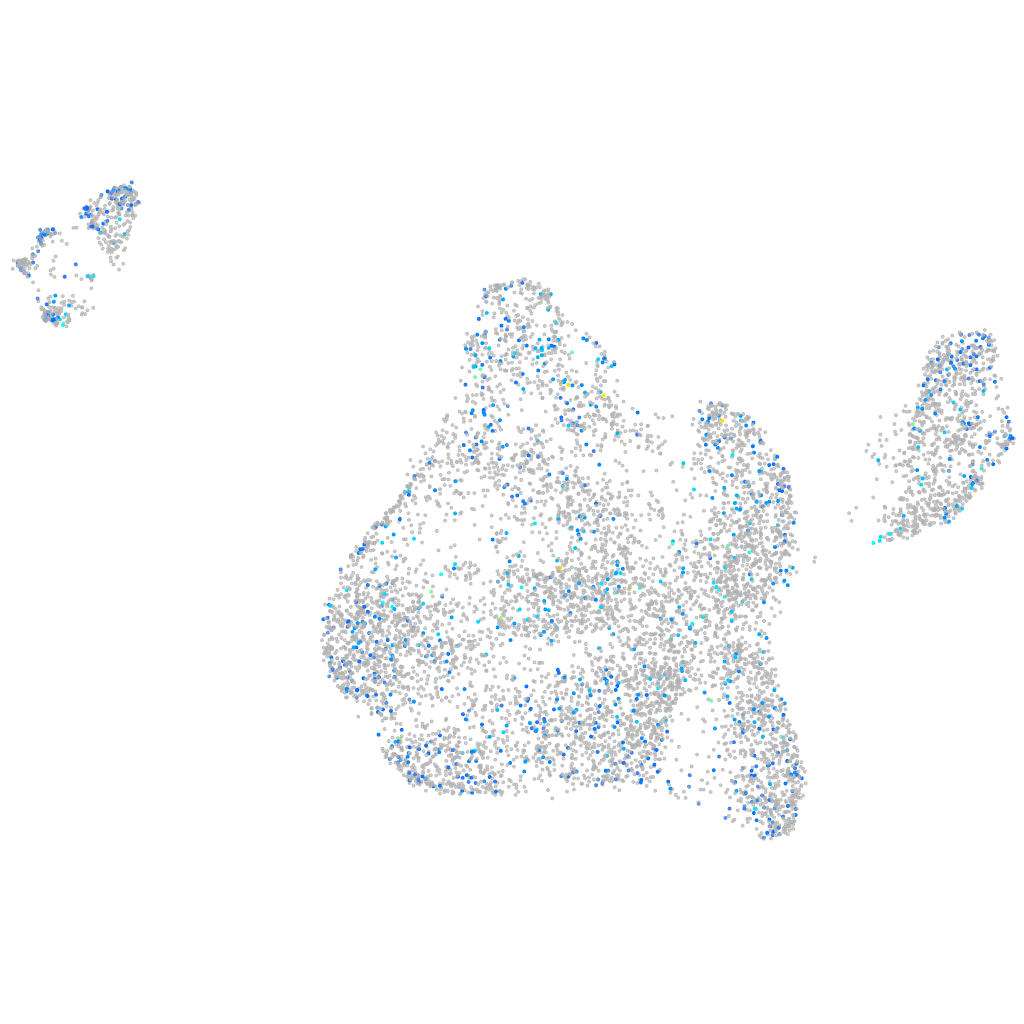
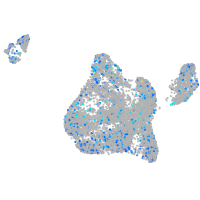
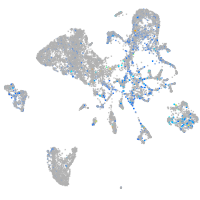
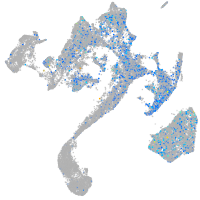
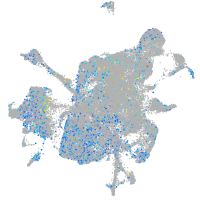
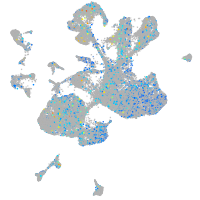
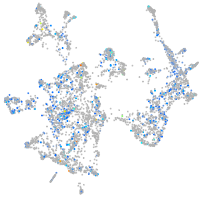
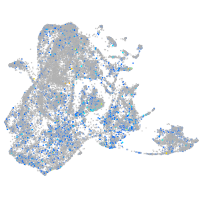
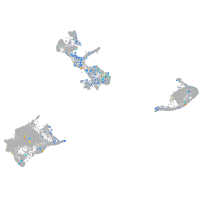
Gene expression UMAP
Display:
Expression
Stage
Other cell groups
all cells
blastomeres
PGCs
endoderm
axial mesoderm
muscle
mural cells /
non-skeletal muscle
mesenchyme
hematopoietic /
vasculature
pronephros
neural
spinal cord / glia
eye
taste / olfactory
otic / lateral line
epidermis
periderm
fin
ionocytes / mucous
pigment cells
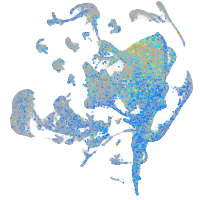
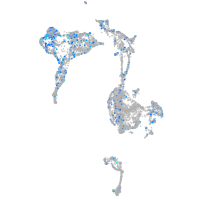
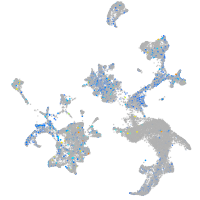
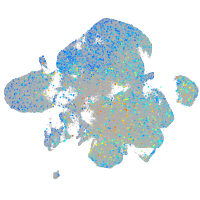
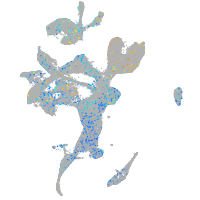
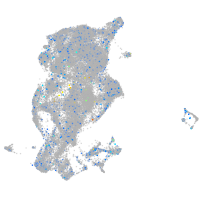
Expression by stage/cluster
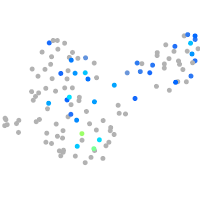
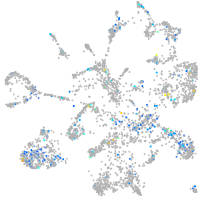
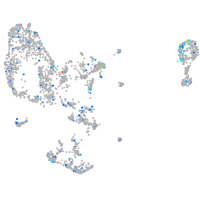
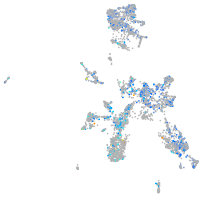
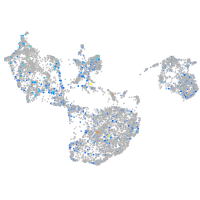
Correlated gene expression
Positive correlation
Negative correlation
Gene
r
Gene
r
ftr55
0.075
hmgn7
-0.061
cth1
0.074
NC-002333.4
-0.060
slc6a6a
0.071
si:ch73-1a9.3
-0.055
CT954240.1
0.068
LOC108190024
-0.050
CR556712.1
0.065
marcksl1b
-0.050
BX901974.2
0.062
si:ch211-222l21.1
-0.047
odf3l2b
0.062
aldob
-0.046
si:dkeyp-34c12.1
0.061
si:ch1073-80i24.3
-0.045
CABZ01069022.2
0.061
apoeb
-0.045
gdpd4b
0.061
si:ch211-152c2.3
-0.042
pip4k2aa
0.061
polr3gla
-0.041
ccna1
0.060
sox3
-0.041
XLOC-029934
0.058
anp32b
-0.040
sod1
0.058
hmgb2a
-0.040
cldng
0.058
hspb1
-0.038
grn1
0.057
hmgn6
-0.037
fpgt
0.057
CR383676.1
-0.035
ccdc186
0.057
stm
-0.035
zgc:77486
0.056
hnrnpa0b
-0.034
trim35-27
0.056
nop56
-0.034
mir203b
0.056
hmga1a
-0.033
snx2
0.056
apoc1
-0.032
BX950865.1
0.056
dynll1
-0.032
lrrc59
0.055
rps12
-0.031
ca15b
0.055
si:dkey-56m19.5
-0.031
kti12
0.055
ptmab
-0.031
ankrd52a
0.055
rplp1
-0.030
ckbb
0.055
rps15
-0.029
rbfa
0.054
si:dkey-151g10.6
-0.029
h2af1al
0.054
si:ch211-212k18.5
-0.028
srpk1a
0.054
si:ch211-108d22.2
-0.028
tktb
0.054
znf1001
-0.028
aplnrb
0.054
rpl26
-0.028
LOC108182577
0.054
rps18
-0.027
BX927081.1
0.054
cxcl12a
-0.026