Daniocell
mbd5 (pronephros)
methyl-CpG binding domain protein 5
ZFIN
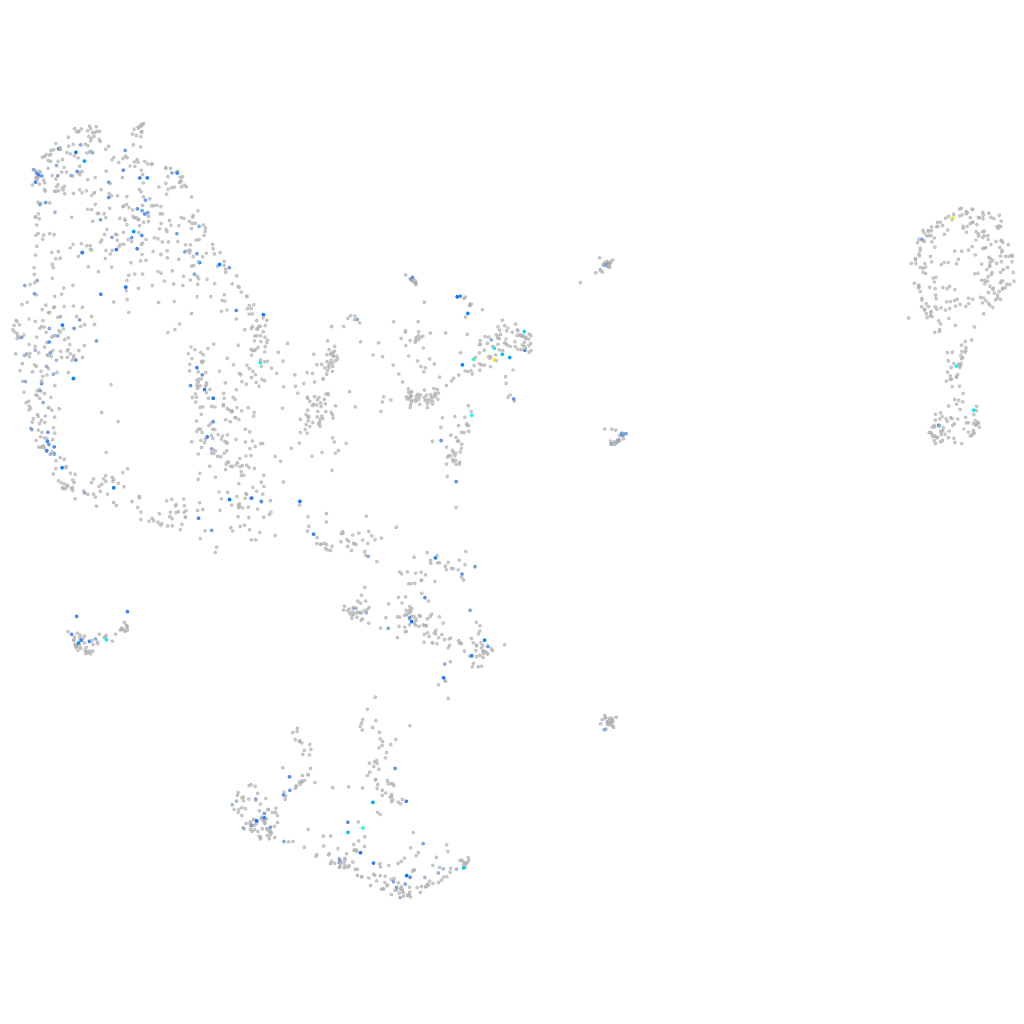
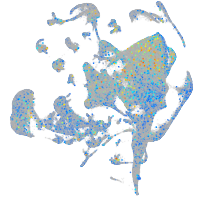
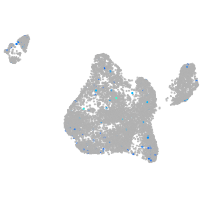
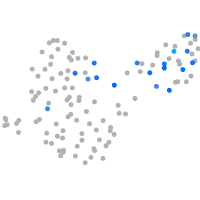
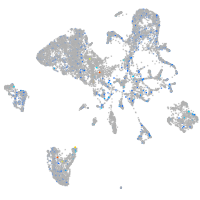
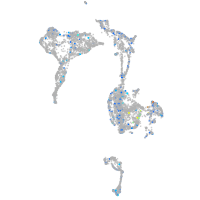
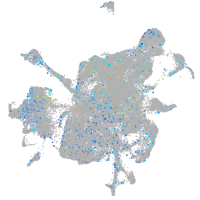
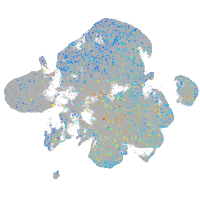
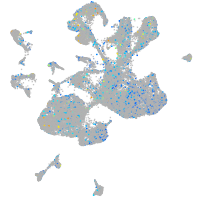
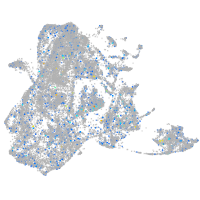
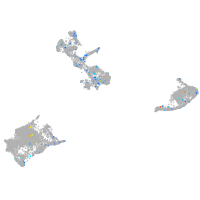
Gene expression UMAP
Display:
Expression
Stage
Other cell groups
all cells
blastomeres
PGCs
endoderm
axial mesoderm
muscle
mural cells /
non-skeletal muscle
mesenchyme
hematopoietic /
vasculature
pronephros
neural
spinal cord / glia
eye
taste / olfactory
otic / lateral line
epidermis
periderm
fin
ionocytes / mucous
pigment cells
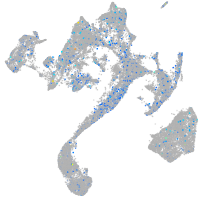
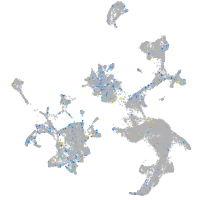
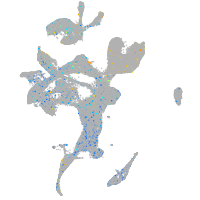
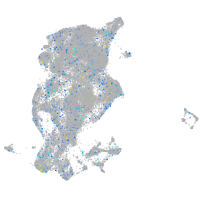
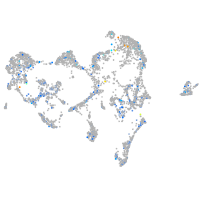
Expression by stage/cluster
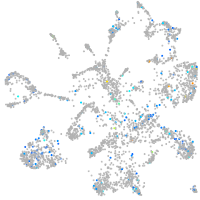
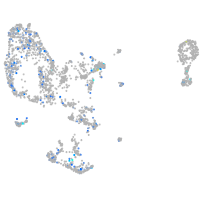
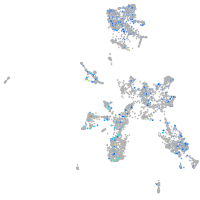
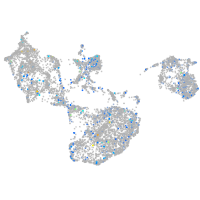
Correlated gene expression
Positive correlation
Negative correlation
Gene
r
Gene
r
pcdh2ab5
0.234
zgc:110425
-0.076
BX545917.5
0.231
nom1
-0.071
si:dkey-201g16.1
0.228
rps12
-0.070
LOC100536716
0.213
ppp1r3b
-0.067
tmcc2
0.209
wu:fb97g03
-0.066
gpsm1b
0.199
msna
-0.065
pcdh1g26
0.195
BX927258.1
-0.064
ANKFN1
0.187
slbp
-0.063
glulc
0.183
ebna1bp2
-0.062
LOC110439381
0.183
eef1a1l1
-0.062
CT737196.1
0.183
chmp2a
-0.062
si:ch73-329n5.6
0.183
crnkl1
-0.061
helq
0.182
cxcl12a
-0.061
si:dkey-237g15.2
0.179
hmgb2a
-0.061
CR354398.1
0.179
si:ch211-214j24.10
-0.060
FQ377603.1
0.179
brd7
-0.060
LOC110440183
0.179
pdap1a
-0.060
si:ch211-277e21.1
0.179
si:dkey-66i24.9
-0.060
si:dkey-1m11.6
0.179
utp11l
-0.059
BX255944.1
0.179
hspb1
-0.059
LOC101884680
0.177
ilf3b
-0.059
cdh30
0.177
rps28
-0.059
fbxo43
0.177
lyar
-0.059
BX005234.1
0.172
tpm4a
-0.058
si:ch73-194h10.2
0.172
rbmx2
-0.058
si:dkey-61l1.4
0.171
ube2na
-0.056
kcnn3
0.170
si:ch211-217k17.7
-0.056
ftr85
0.169
fgfr1op2
-0.056
CU681841.1
0.169
amotl2a
-0.056
si:dkeyp-9d4.2
0.169
fbl
-0.055
rem2
0.168
nme3
-0.055
LOC110439397
0.168
sec13
-0.054
tfpi2
0.168
nudc
-0.054
gphb5
0.166
apoc1
-0.054
pdzrn4
0.166
paics
-0.053