
membrane-associated ring finger (C3HC4) 8
ZFIN 
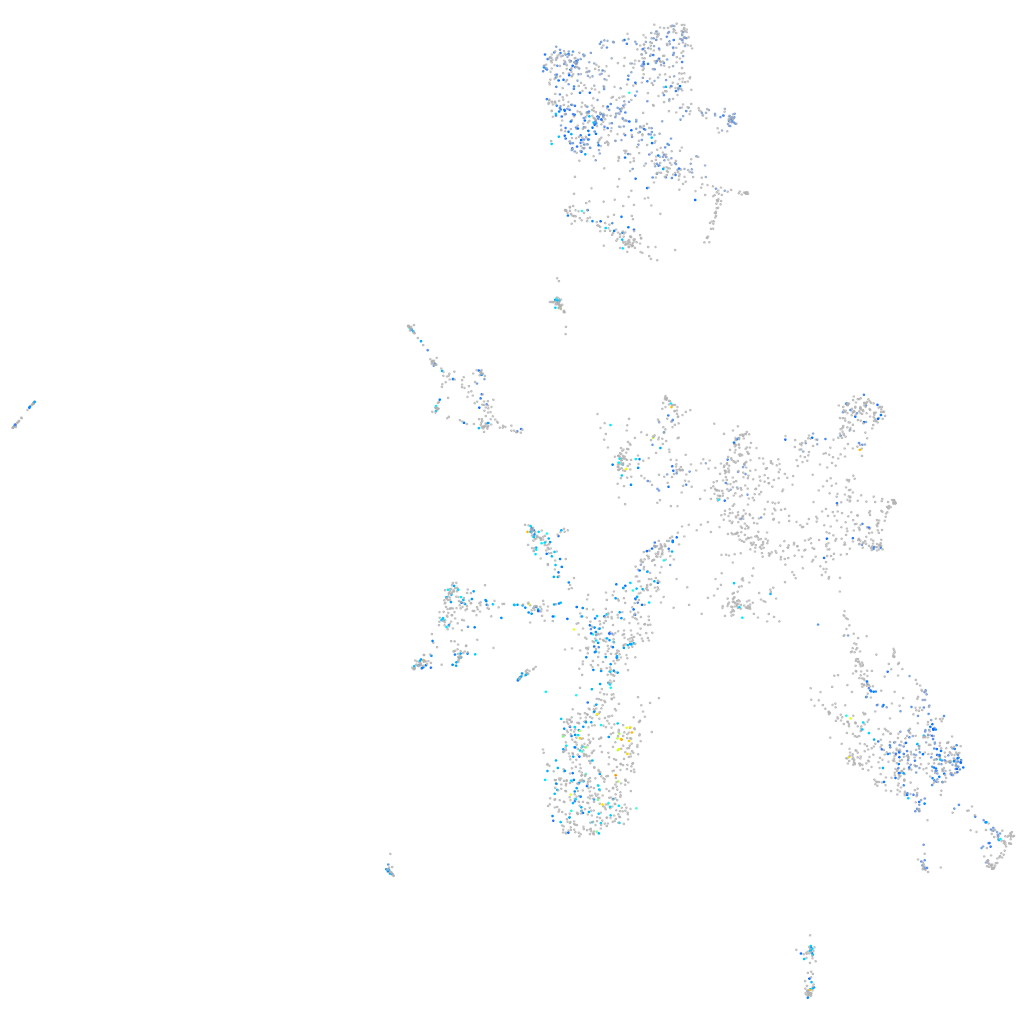
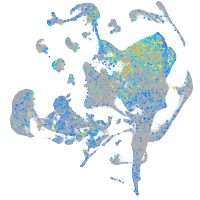
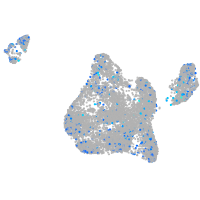
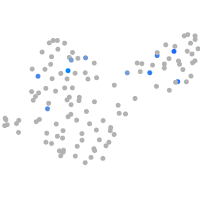
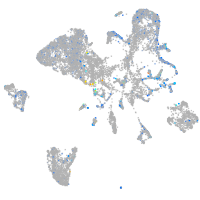
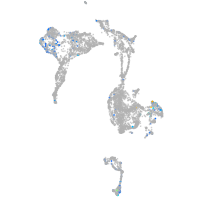
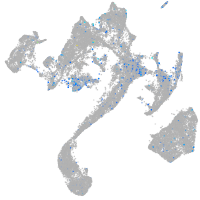
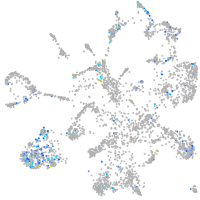
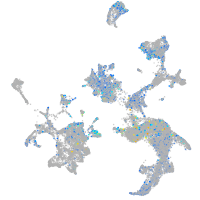
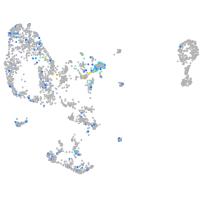
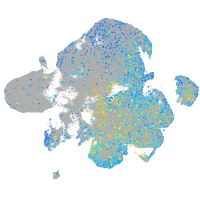
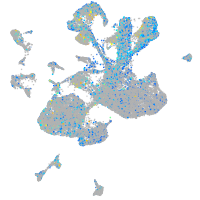
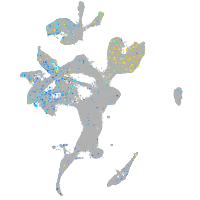
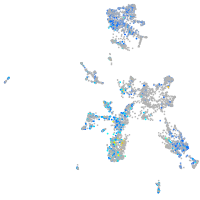
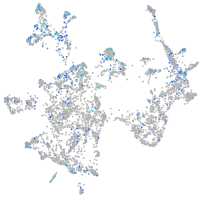
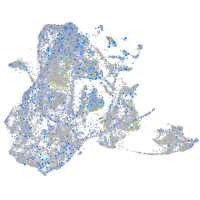
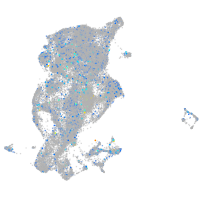
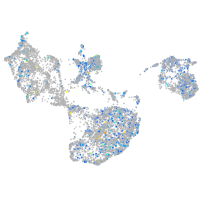
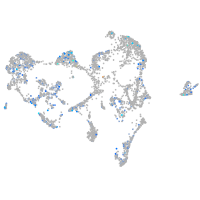
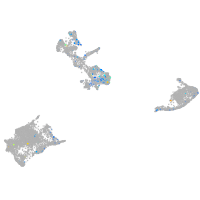
Gene expression UMAP


Expression by stage/cluster
Correlated gene expression
| Positive correlation | Negative correlation | ||
| Gene | r | Gene | r |
| rtn1a | 0.209 | rplp1 | -0.206 |
| gnb1a | 0.202 | rplp2l | -0.187 |
| vamp2 | 0.197 | rpl13a | -0.184 |
| uchl1 | 0.192 | rps14 | -0.179 |
| calm1a | 0.191 | rpl37 | -0.179 |
| atp6v1e1b | 0.190 | rpl26 | -0.178 |
| tspan2a | 0.189 | rpl36a | -0.177 |
| zgc:65894 | 0.187 | rps19 | -0.176 |
| gabarapa | 0.186 | rps27a | -0.176 |
| chga | 0.181 | rps12 | -0.174 |
| si:dkeyp-75h12.5 | 0.181 | si:dkey-151g10.6 | -0.174 |
| anxa5b | 0.181 | rps24 | -0.173 |
| scg2b | 0.180 | rps10 | -0.173 |
| tmem59 | 0.178 | rps15 | -0.172 |
| txn | 0.178 | rps9 | -0.170 |
| rab6bb | 0.177 | rps20 | -0.169 |
| gdi1 | 0.177 | zgc:114188 | -0.169 |
| atp6v0cb | 0.175 | rpl10a | -0.168 |
| gapdhs | 0.175 | rps3a | -0.167 |
| rnasekb | 0.174 | rpl10 | -0.165 |
| gng3 | 0.172 | faua | -0.164 |
| atp2b1b | 0.172 | rps15a | -0.164 |
| syt1a | 0.171 | rps7 | -0.164 |
| adcyap1b | 0.171 | rpl12 | -0.161 |
| vsig8a | 0.170 | rpl17 | -0.160 |
| map1aa | 0.170 | rpl23a | -0.159 |
| pvalb5 | 0.169 | rpl31 | -0.159 |
| gabarapb | 0.169 | rps25 | -0.159 |
| atp6v1g1 | 0.169 | rpl13 | -0.158 |
| cdc25d | 0.167 | rpl7 | -0.157 |
| fstl5 | 0.167 | rpl27 | -0.157 |
| msi2b | 0.166 | rpl15 | -0.156 |
| cldnh | 0.165 | rpl18a | -0.154 |
| gsna | 0.164 | rpl14 | -0.154 |
| ank2b | 0.164 | rpl9 | -0.154 |