Daniocell
mapta (mural cells / non-skeletal muscle)
microtubule-associated protein tau a
ZFIN
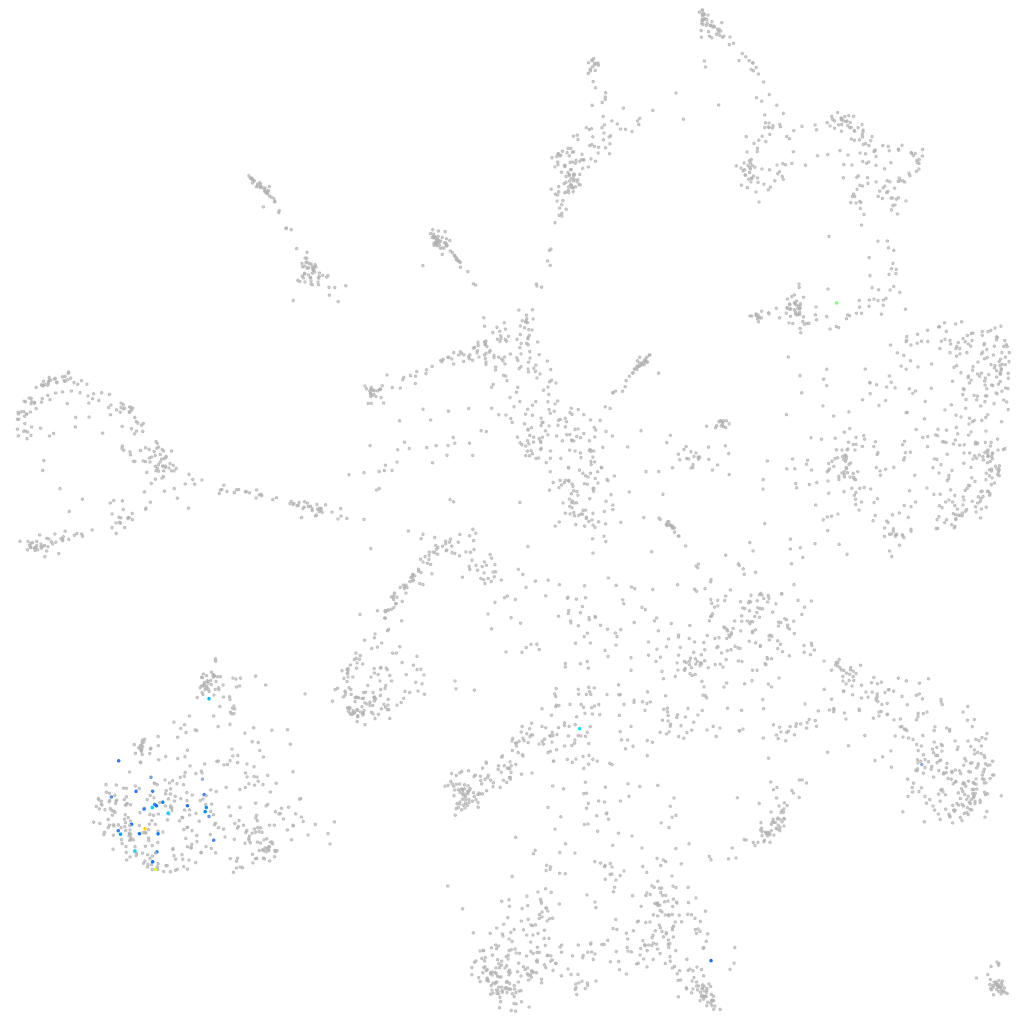
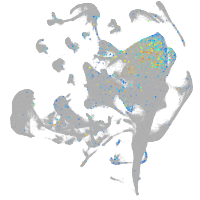
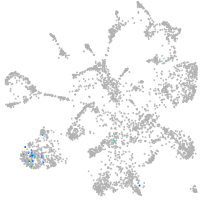
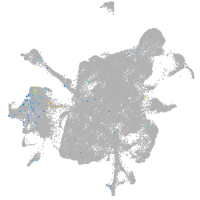
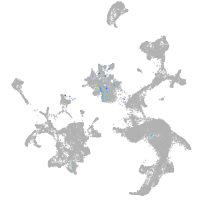
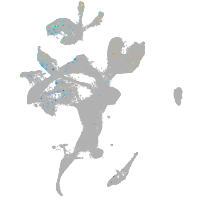
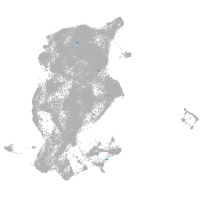
Gene expression UMAP
Display:
Expression
Stage
Other cell groups
all cells
blastomeres
PGCs
endoderm
axial mesoderm
muscle
mural cells /
non-skeletal muscle
mesenchyme
hematopoietic /
vasculature
pronephros
neural
spinal cord / glia
eye
taste / olfactory
otic / lateral line
epidermis
periderm
fin
ionocytes / mucous
pigment cells
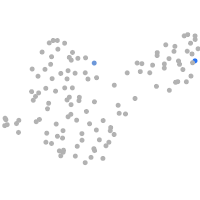
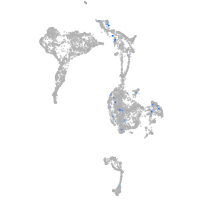
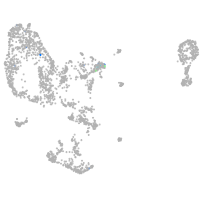
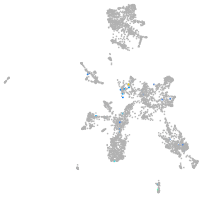
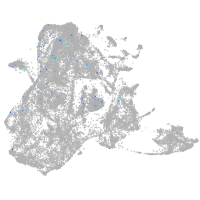
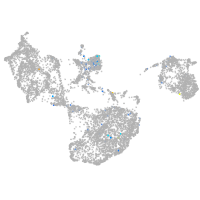
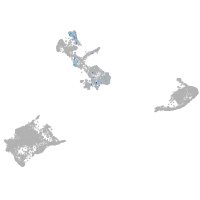
Expression by stage/cluster
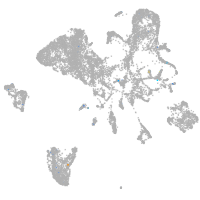
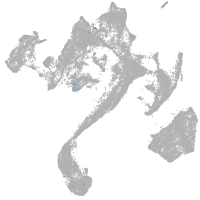
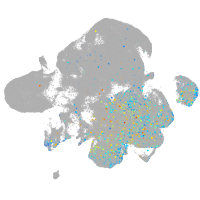
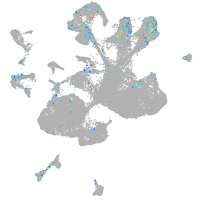
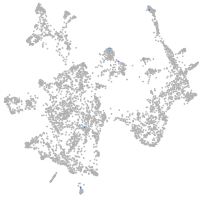
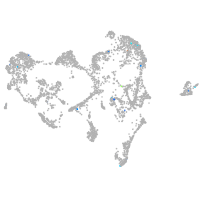
Correlated gene expression
Positive correlation
Negative correlation
Gene
r
Gene
r
LOC108182766
0.399
eef1da
-0.054
si:ch1073-82l19.1
0.399
tpm4a
-0.050
XLOC-023624
0.382
sparc
-0.049
CR786582.1
0.340
sdc4
-0.049
BX649324.1
0.319
si:dkey-7j14.6
-0.048
LOC100535396
0.319
junba
-0.044
LOC110438240
0.302
rpl23
-0.043
LOC108183423
0.296
cebpd
-0.043
btbd3b
0.264
fosab
-0.042
rab27b
0.258
tspan7
-0.042
FP016106.1
0.256
rps27a
-0.041
CR774194.1
0.240
rps11
-0.041
LO018437.1
0.240
ddah2
-0.040
BX649478.1
0.238
zgc:162730
-0.040
LO018363.2
0.236
rpl12
-0.039
XLOC-023752
0.235
rpl11
-0.039
mllt11
0.234
rpl22
-0.038
rtn1b
0.231
hdlbpa
-0.037
nrn1a
0.228
socs3a
-0.037
ano2
0.226
rps17
-0.037
RASGRF1
0.222
ier2b
-0.036
GALNTL6
0.222
eif4ebp3l
-0.036
nadsyn1
0.218
twist1a
-0.036
CR388190.1
0.216
tns2a
-0.036
XLOC-020106
0.215
entpd1
-0.036
BX005417.1
0.214
rps24
-0.035
etv1
0.211
tagln2
-0.035
kif3ca
0.211
rpsa
-0.035
slc17a6b
0.209
aldh9a1a.1
-0.035
apoda.1
0.207
col6a4a
-0.035
si:ch211-189a15.5
0.207
ednraa
-0.035
camta1
0.206
zgc:56493
-0.035
aqp8a.2
0.204
xbp1
-0.035
tmem178
0.204
rpl10a
-0.034
si:dkey-276j7.1
0.202
pmp22a
-0.034