Daniocell
map1lc3c (endoderm)
microtubule-associated protein 1 light chain 3 gamma
ZFIN
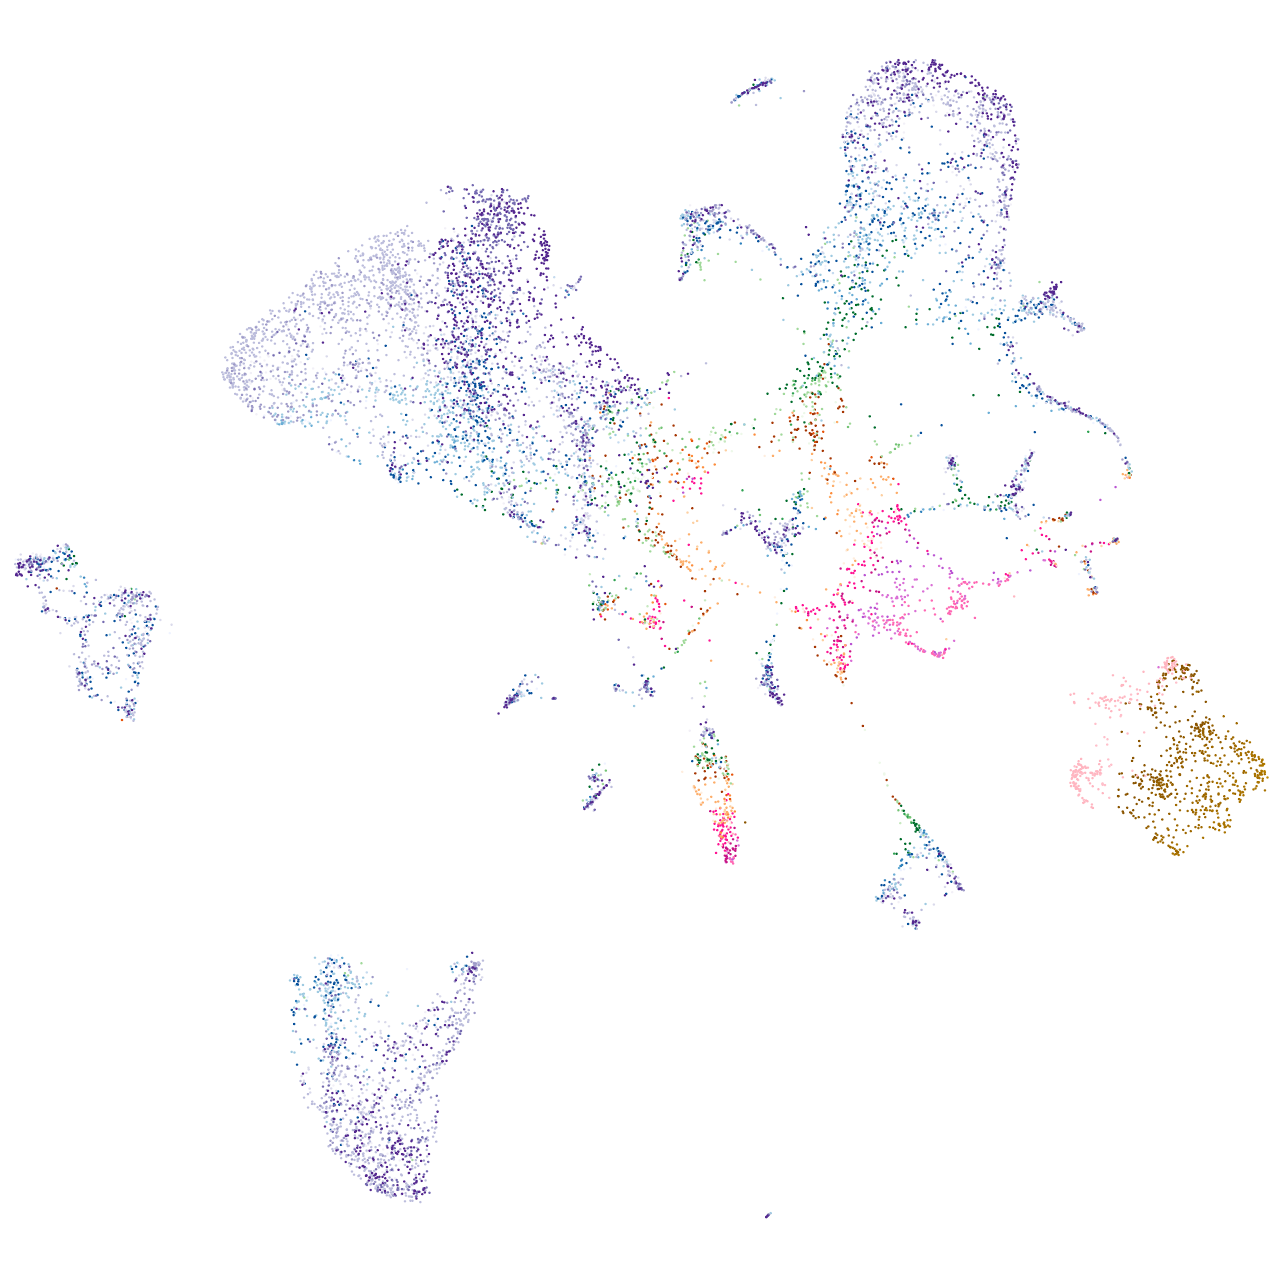
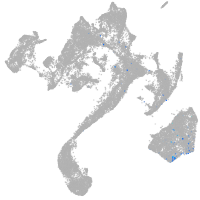
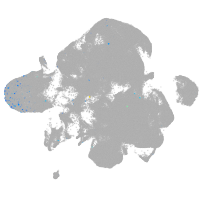
Gene expression UMAP
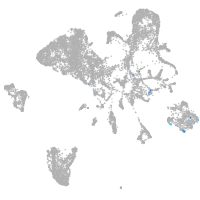
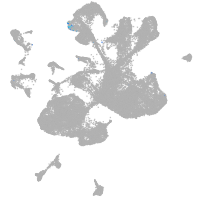
Display:
Expression
Stage
Other cell groups
all cells
blastomeres
PGCs
endoderm
axial mesoderm
muscle
mural cells /
non-skeletal muscle
mesenchyme
hematopoietic /
vasculature
pronephros
neural
spinal cord / glia
eye
taste / olfactory
otic / lateral line
epidermis
periderm
fin
ionocytes / mucous
pigment cells
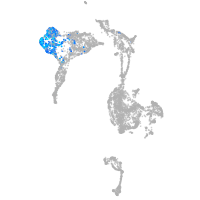
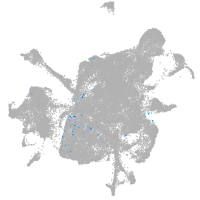
Expression by stage/cluster
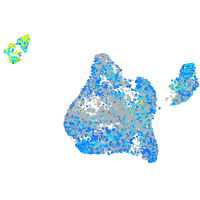
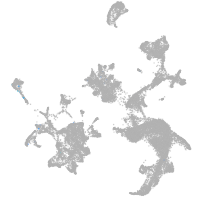
Correlated gene expression
Positive correlation
Negative correlation
Gene
r
Gene
r
FOXN2
0.342
rps10
-0.076
LOC110439626
0.312
rpl37
-0.075
LOC110438679
0.302
zgc:114188
-0.069
XLOC-038935
0.294
rps17
-0.062
XLOC-000324
0.267
nme2b.1
-0.062
zgc:152986
0.249
rplp0
-0.056
CU929150.2
0.243
uba52
-0.052
lft1
0.232
sod1
-0.050
gltpb
0.226
atp5if1b
-0.048
BX088688.3
0.221
zgc:56493
-0.047
ccna1
0.216
cox6a1
-0.046
CT583626.1
0.216
zgc:158463
-0.046
BX571954.1
0.216
rpl24
-0.045
CR786576.1
0.216
atp5mc3b
-0.045
CU062487.1
0.216
mt-atp6
-0.044
LOC103910633
0.216
eef1g
-0.044
LOC108180010
0.216
atp5l
-0.044
prl2
0.216
eno3
-0.043
si:dkey-245f22.3
0.216
prdx2
-0.043
taar18d
0.216
rps14
-0.042
XLOC-041356
0.216
rpl19
-0.042
zgc:112965
0.216
ahcy
-0.042
si:dkeyp-85h7.1
0.216
mdh1aa
-0.041
si:dkey-21o22.2
0.215
mt-nd1
-0.041
LOC101885896
0.215
atox1
-0.041
si:ch211-223m11.2
0.214
cox6b1
-0.041
si:ch211-191j22.7
0.213
rpl21
-0.041
si:dkey-23f9.9
0.213
mdh2
-0.040
si:ch1073-186o8.3
0.208
atp5f1b
-0.040
LOC110440062
0.204
suclg1
-0.040
stk31
0.203
cox4i1
-0.040
si:ch211-202h22.10
0.202
fabp3
-0.040
piwil1
0.201
rpl28
-0.039
CR759875.1
0.199
rpl10
-0.039
lft2
0.186
adh5
-0.039