Daniocell
map1lc3a (fin)
microtubule-associated protein 1 light chain 3 alpha
ZFIN
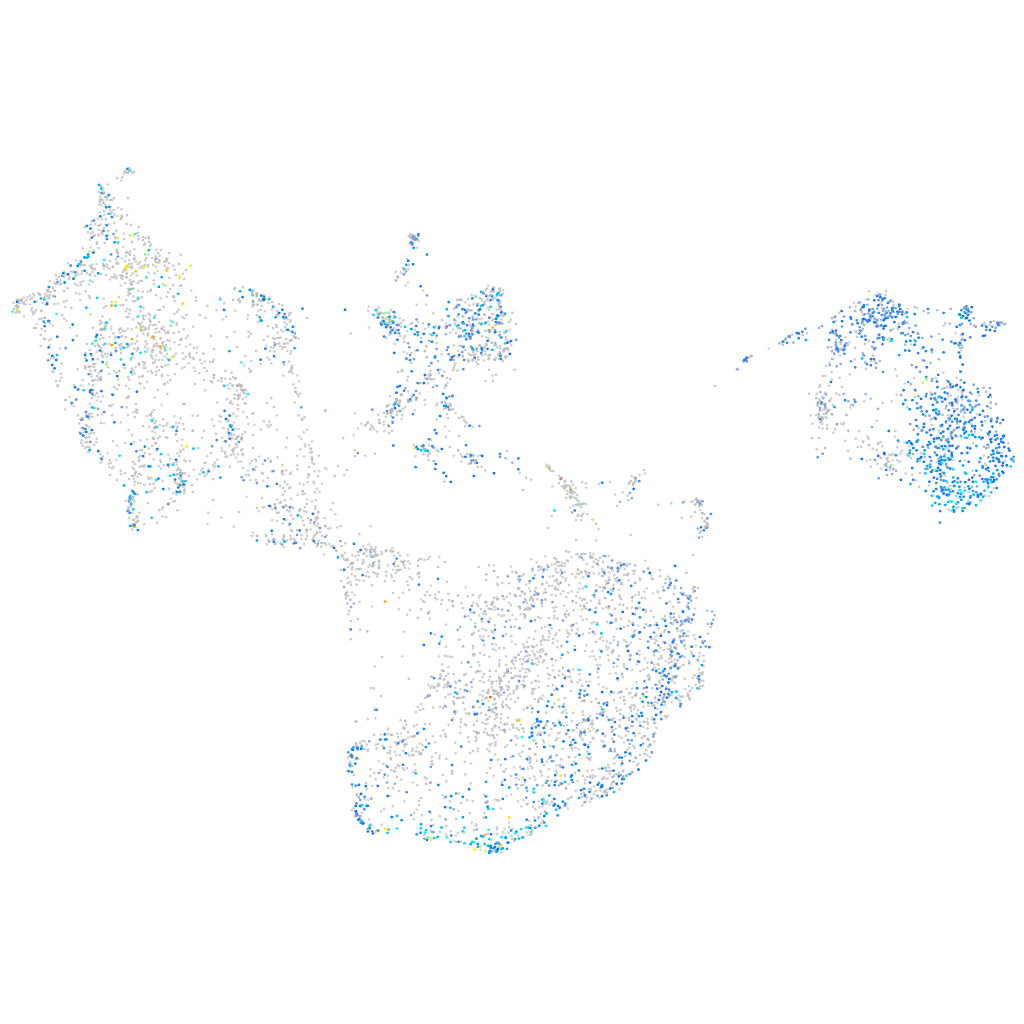
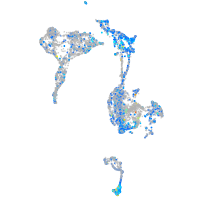
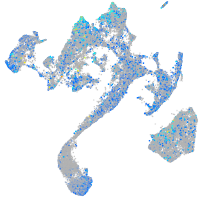
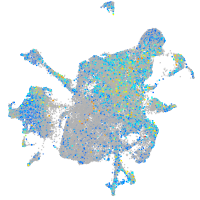
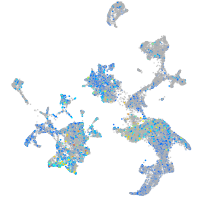
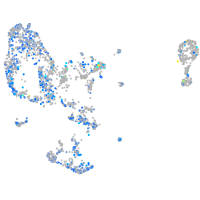
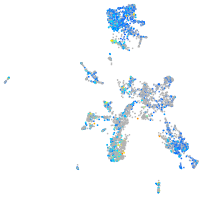
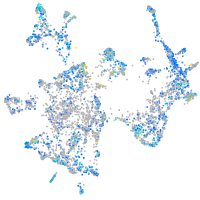
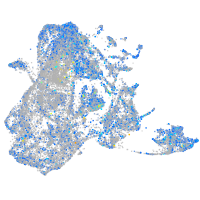
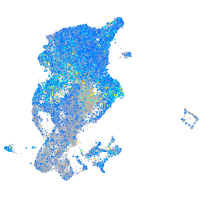
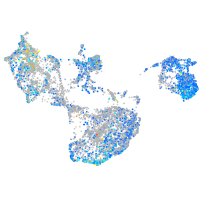
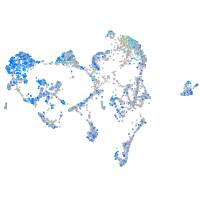
Gene expression UMAP
Display:
Expression
Stage
Other cell groups
all cells
blastomeres
PGCs
endoderm
axial mesoderm
muscle
mural cells /
non-skeletal muscle
mesenchyme
hematopoietic /
vasculature
pronephros
neural
spinal cord / glia
eye
taste / olfactory
otic / lateral line
epidermis
periderm
fin
ionocytes / mucous
pigment cells
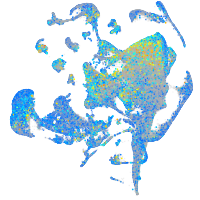
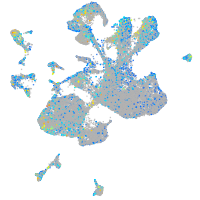
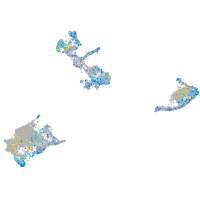
Expression by stage/cluster
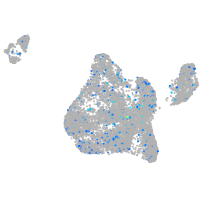
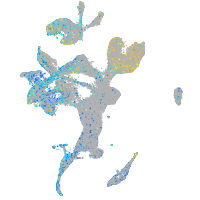
Correlated gene expression
Positive correlation
Negative correlation
Gene
r
Gene
r
zgc:111983
0.303
rplp2l
-0.223
si:ch211-125o16.4
0.302
si:dkey-151g10.6
-0.216
spint2
0.299
si:ch211-222l21.1
-0.193
si:dkey-222n6.2
0.299
rps29
-0.189
cldnb
0.293
rpl38
-0.183
si:ch211-207n23.2
0.292
rplp1
-0.178
cldn23a
0.290
ost4
-0.166
si:ch211-217k17.9
0.289
rpl29
-0.165
dhrs13a.2
0.289
si:ch73-1a9.3
-0.164
cldne
0.288
rps12
-0.163
mid1ip1a
0.283
rps28
-0.163
stard14
0.281
rpl39
-0.159
si:ch73-204p21.2
0.279
rpl37
-0.149
fuca1.1
0.278
stmn1a
-0.148
si:ch73-52f15.5
0.276
sub1a
-0.141
scel
0.274
postnb
-0.138
tmem45b
0.273
rpl36a
-0.135
stx11b.1
0.273
si:ch73-281n10.2
-0.129
anxa1b
0.271
rps20
-0.128
lye
0.271
hmga1a
-0.127
selenow2b
0.270
rps21
-0.123
si:dkeyp-51b9.3
0.267
nucks1a
-0.120
cd9b
0.267
rpl22l1
-0.120
si:dkey-221j11.3
0.267
fkbp9
-0.118
zgc:110333
0.266
h2afvb
-0.116
nupr1a
0.265
dut
-0.113
znf185
0.264
tma7
-0.111
gbgt1l4
0.263
col28a2a
-0.109
apodb
0.263
frem3
-0.108
si:ch211-157c3.4
0.261
pabpc1a
-0.106
oclnb
0.260
scinla
-0.105
anxa1c
0.260
zgc:165555.3
-0.105
cebpa
0.260
ppib
-0.105
CABZ01027551.1
0.259
pcna
-0.104
zgc:123217
0.258
fen1
-0.104