Daniocell
manba (mesenchyme)
"mannosidase, beta A, lysosomal"
ZFIN
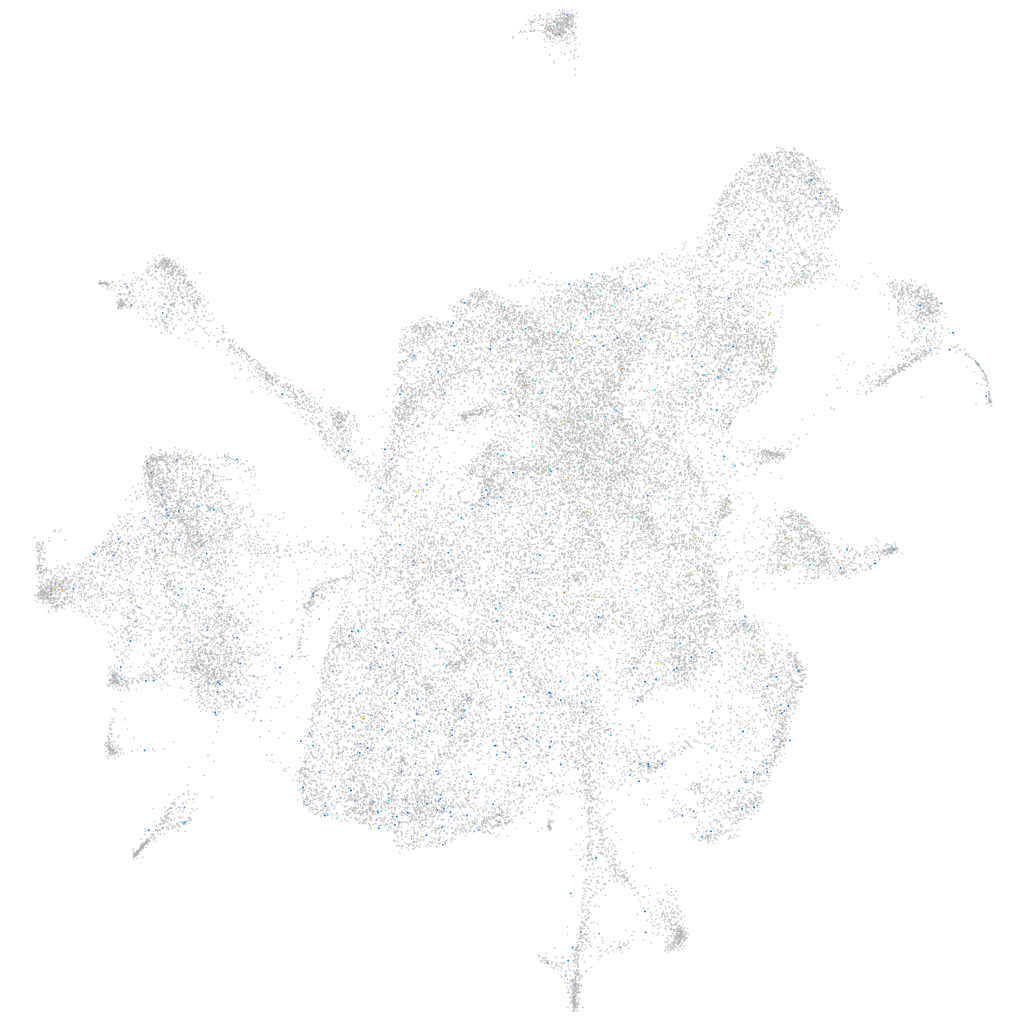
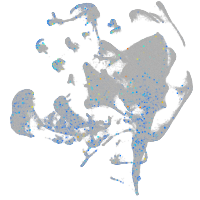
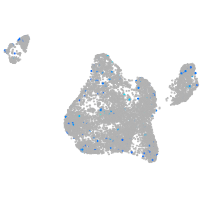
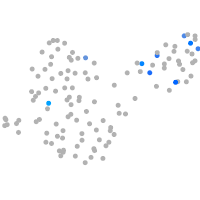
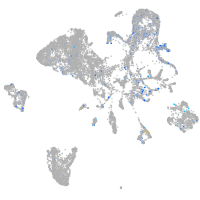
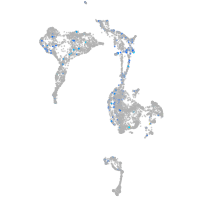
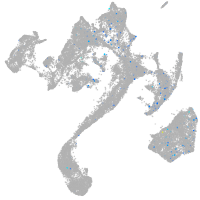
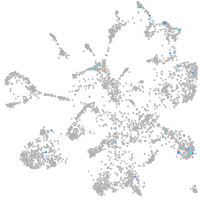
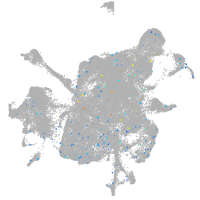
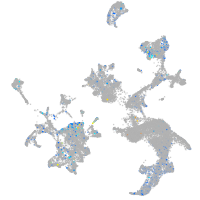
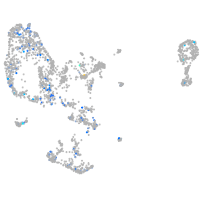
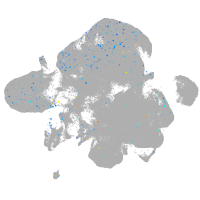
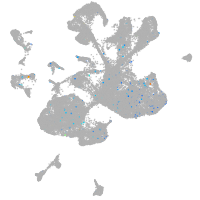
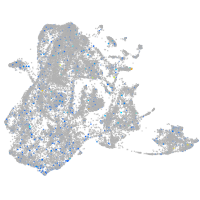
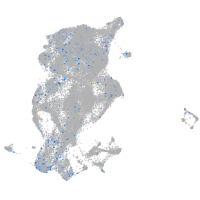
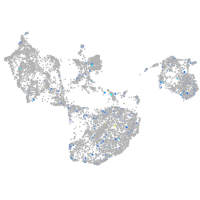
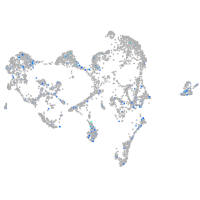
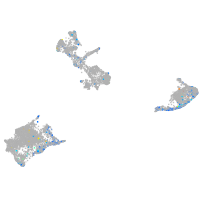
Gene expression UMAP
Display:
Expression
Stage
Other cell groups
all cells
blastomeres
PGCs
endoderm
axial mesoderm
muscle
mural cells /
non-skeletal muscle
mesenchyme
hematopoietic /
vasculature
pronephros
neural
spinal cord / glia
eye
taste / olfactory
otic / lateral line
epidermis
periderm
fin
ionocytes / mucous
pigment cells
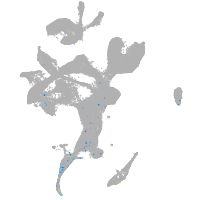
Expression by stage/cluster
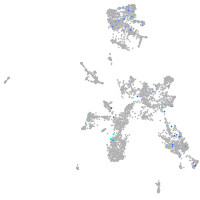
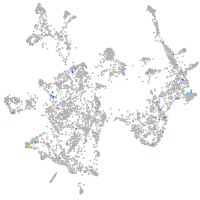
Correlated gene expression
Positive correlation
Negative correlation
Gene
r
Gene
r
si:ch73-166o21.1
0.085
rpl37
-0.022
si:dkey-238o14.7
0.072
rpl39
-0.020
BX005154.1
0.068
rpl27a
-0.018
lingo3a
0.067
sec61g
-0.017
CU929359.2
0.062
rps12
-0.015
CU915770.1
0.061
rpl30
-0.015
erc1b
0.061
fgfbp2b
-0.015
AL929520.2
0.060
rps24
-0.015
LOC110439905
0.057
rpl34
-0.014
LOC110438454
0.052
rpl7a
-0.014
trim35-33
0.050
rplp0
-0.014
CABZ01034082.1
0.050
rpl22
-0.014
XLOC-043261
0.049
rpl38
-0.014
LOC101886528
0.049
rps29
-0.014
pth1a
0.049
rplp2l
-0.013
XLOC-020173
0.048
si:dkey-151g10.6
-0.013
grid2ipa
0.048
eef1b2
-0.013
zmp:0000001006
0.048
copz2
-0.013
tmem232
0.048
rpl29
-0.013
myct1b
0.048
fam160b1
-0.012
XLOC-009785
0.047
rps20
-0.012
LOC100536609
0.046
ost4
-0.012
slc26a4
0.046
rpl18a
-0.012
CR774179.2
0.046
wdr46
-0.012
CR293531.1
0.045
tnxba
-0.012
il17a/f2
0.044
bmpr1ba
-0.011
crybb2
0.043
hbbe1.2
-0.011
micall1b.2
0.043
pycr1b
-0.011
cx31.7
0.043
ppm1ba
-0.011
tfcp2l1
0.042
rps14
-0.011
XLOC-022550
0.042
rpl35
-0.011
loxl5a
0.042
srprb
-0.011
BX649295.2
0.042
zgc:153675
-0.011
si:dkey-103k4.1
0.042
galnt2
-0.011
LOC101882525
0.041
mbd4
-0.011