Daniocell
mafgb (periderm)
v-maf avian musculoaponeurotic fibrosarcoma oncogene homolog Gb
ZFIN
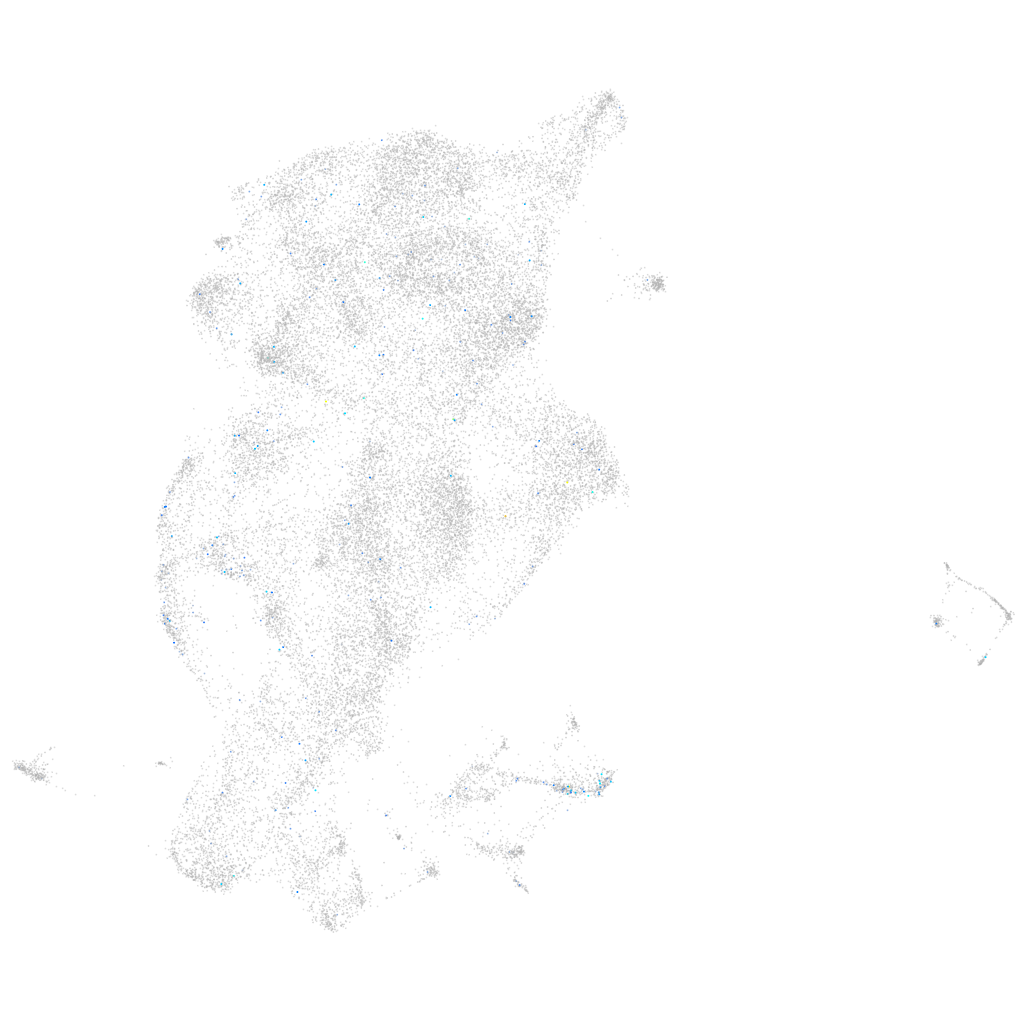
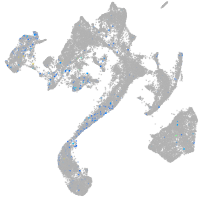
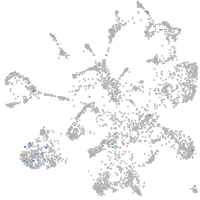
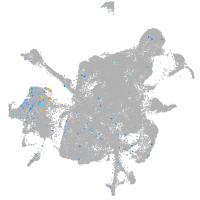
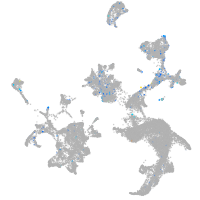
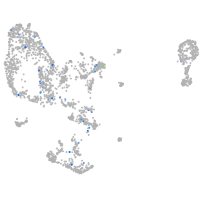
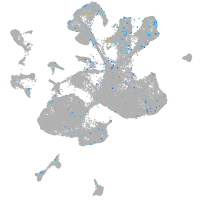
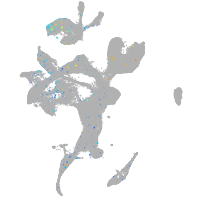
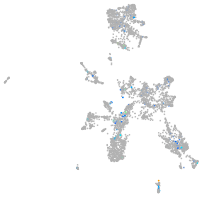
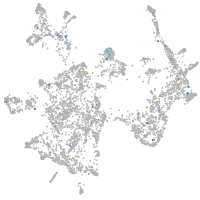
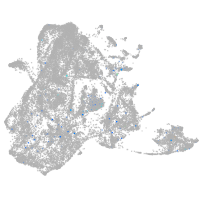
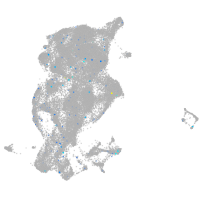
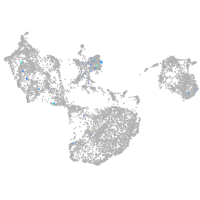
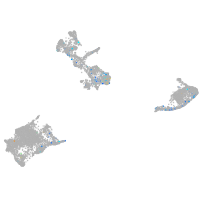
Gene expression UMAP
Display:
Expression
Stage
Other cell groups
all cells
blastomeres
PGCs
endoderm
axial mesoderm
muscle
mural cells /
non-skeletal muscle
mesenchyme
hematopoietic /
vasculature
pronephros
neural
spinal cord / glia
eye
taste / olfactory
otic / lateral line
epidermis
periderm
fin
ionocytes / mucous
pigment cells
Expression by stage/cluster
Correlated gene expression
Positive correlation
Negative correlation
Gene
r
Gene
r
wdr38
0.191
krt4
-0.045
chrm2a
0.139
cyt1
-0.045
FQ311920.1
0.134
si:ch211-195b11.3
-0.033
or105-1
0.134
krt5
-0.030
LOC101882789
0.132
krt17
-0.030
tgm1l2
0.121
si:dkey-112e7.2
-0.028
dpp6a
0.117
cfl1l
-0.028
nfil3-4
0.112
s100w
-0.027
LOC110438412
0.112
agr1
-0.027
XLOC-002610
0.105
pycard
-0.026
epn3b
0.099
cyt1l
-0.026
kcnf1b
0.099
si:ch211-157c3.4
-0.025
ppp1r14ba
0.099
anxa2a
-0.024
kcnk3a
0.096
aldh9a1a.1
-0.023
si:ch1073-138d10.2
0.094
glo1
-0.023
LOC799796
0.092
pdlim2
-0.022
pcdh2ab5
0.091
rpl12
-0.022
pcdh7a
0.090
zgc:193505
-0.022
si:dkey-14d8.20
0.088
icn2
-0.022
CR513785.1
0.088
s100v2
-0.021
LOC100005689
0.088
fxyd6l
-0.021
kcnk2b
0.085
rpl39
-0.020
tnfrsf13b
0.084
wu:fb18f06
-0.020
CR354556.1
0.084
s100a10b
-0.020
BX005389.3
0.083
selenow2b
-0.019
pfkpa
0.083
krtt1c19e
-0.019
grin2ab
0.082
capns1a
-0.019
ywhag2
0.082
capns1b
-0.019
rtn1b
0.082
tdh
-0.019
map7d2b
0.081
FQ323156.1
-0.019
zgc:65894
0.081
ubap1la
-0.019
wdr17
0.081
si:dkey-16p21.8
-0.018
plxna4
0.080
ahcy
-0.018
pimr134
0.080
icn
-0.018
atp6v0cb
0.080
scel
-0.017