Daniocell
lrrc8ab (epidermis)
leucine rich repeat containing 8 VRAC subunit Ab
ZFIN
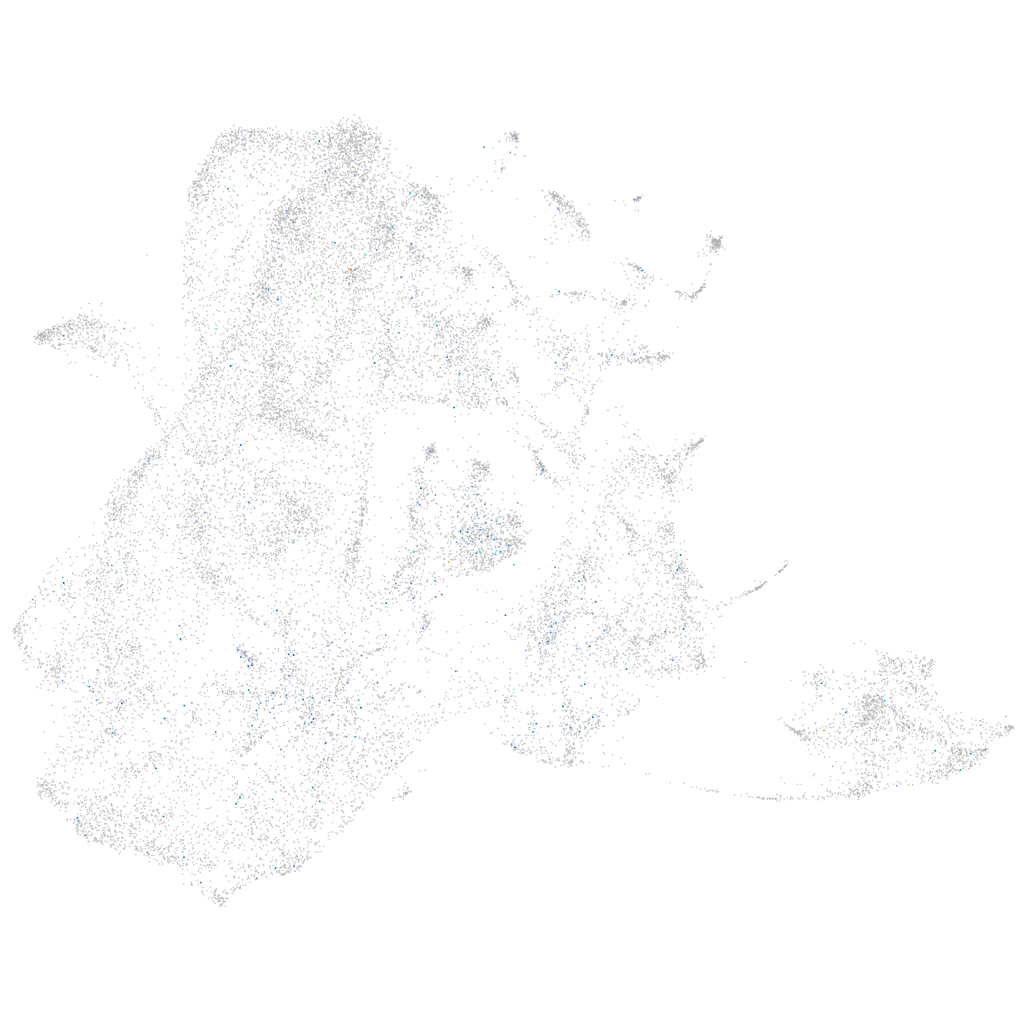
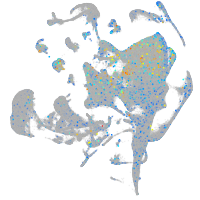
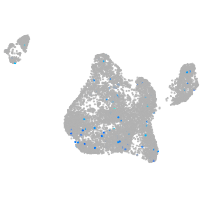
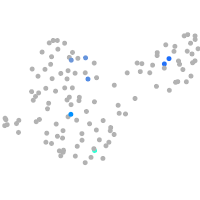
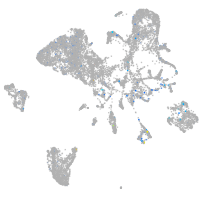
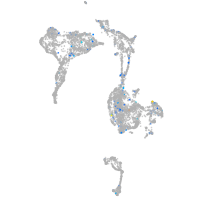
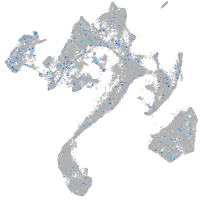
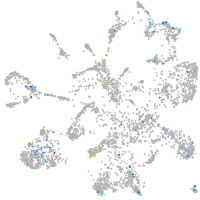
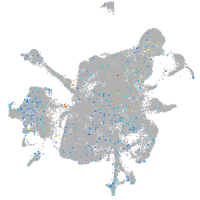
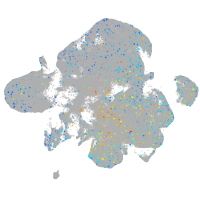
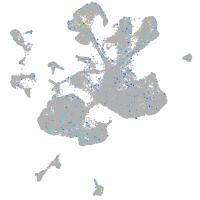
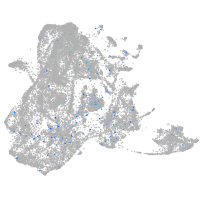
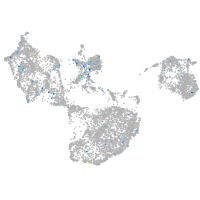
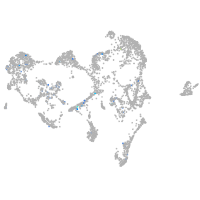
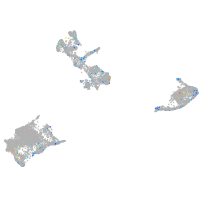
Gene expression UMAP
Display:
Expression
Stage
Other cell groups
all cells
blastomeres
PGCs
endoderm
axial mesoderm
muscle
mural cells /
non-skeletal muscle
mesenchyme
hematopoietic /
vasculature
pronephros
neural
spinal cord / glia
eye
taste / olfactory
otic / lateral line
epidermis
periderm
fin
ionocytes / mucous
pigment cells
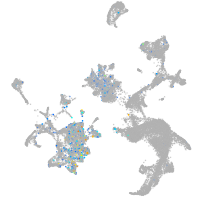
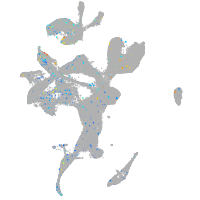
Expression by stage/cluster
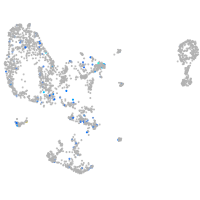
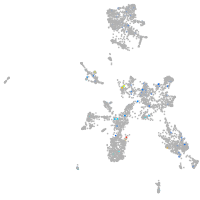
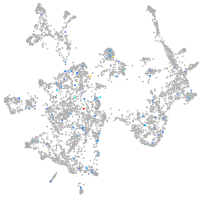
Correlated gene expression
Positive correlation
Negative correlation
Gene
r
Gene
r
LOC108183685
0.163
cfl1l
-0.062
zgc:175280
0.135
pfn1
-0.055
si:ch1073-90m23.1
0.109
tmsb1
-0.053
CR932077.1
0.104
krt4
-0.051
mtnr1al
0.102
s100a10b
-0.050
tmem150c
0.100
actb1
-0.048
FO818699.1
0.096
cyt1
-0.046
LOC103909787
0.096
spaca4l
-0.045
GPR151
0.094
cyt1l
-0.044
cdx1b
0.093
lgals3b
-0.044
si:ch211-284e13.14
0.090
tmsb4x
-0.041
LOC101885178
0.089
cldn1
-0.040
phox2ba
0.089
actb2
-0.040
BX511120.1
0.089
cotl1
-0.039
CU693446.1
0.088
myl12.1
-0.039
galr1b
0.088
tuba8l2
-0.038
MINAR1
0.087
flna
-0.036
si:dkey-117i10.1
0.086
ecrg4b
-0.036
LOC108183555
0.084
scinla
-0.035
rdh5
0.083
zgc:101810
-0.035
edil3b
0.083
cap1
-0.035
lhfpl4b
0.083
padi2
-0.034
cacng5b
0.083
zgc:153867
-0.034
CABZ01057159.1
0.079
krt5
-0.034
pdyn
0.077
arpc3
-0.034
kcnq5a
0.075
cldni
-0.034
HTRA2 (1 of many).11
0.074
anxa1a
-0.033
galr2a
0.074
arpc5b
-0.033
pou4f2
0.074
myh9a
-0.033
stmn1b
0.073
pycard
-0.033
XLOC-039646
0.073
arpc4l
-0.032
taar19h
0.072
anxa2a
-0.032
taar20q
0.072
si:dkey-102c8.3
-0.032
si:dkey-19b23.7
0.072
zgc:86896
-0.031
neurl1ab
0.069
rac2
-0.031