Daniocell
lrmda (pronephros)
leucine rich melanocyte differentiation associated
ZFIN
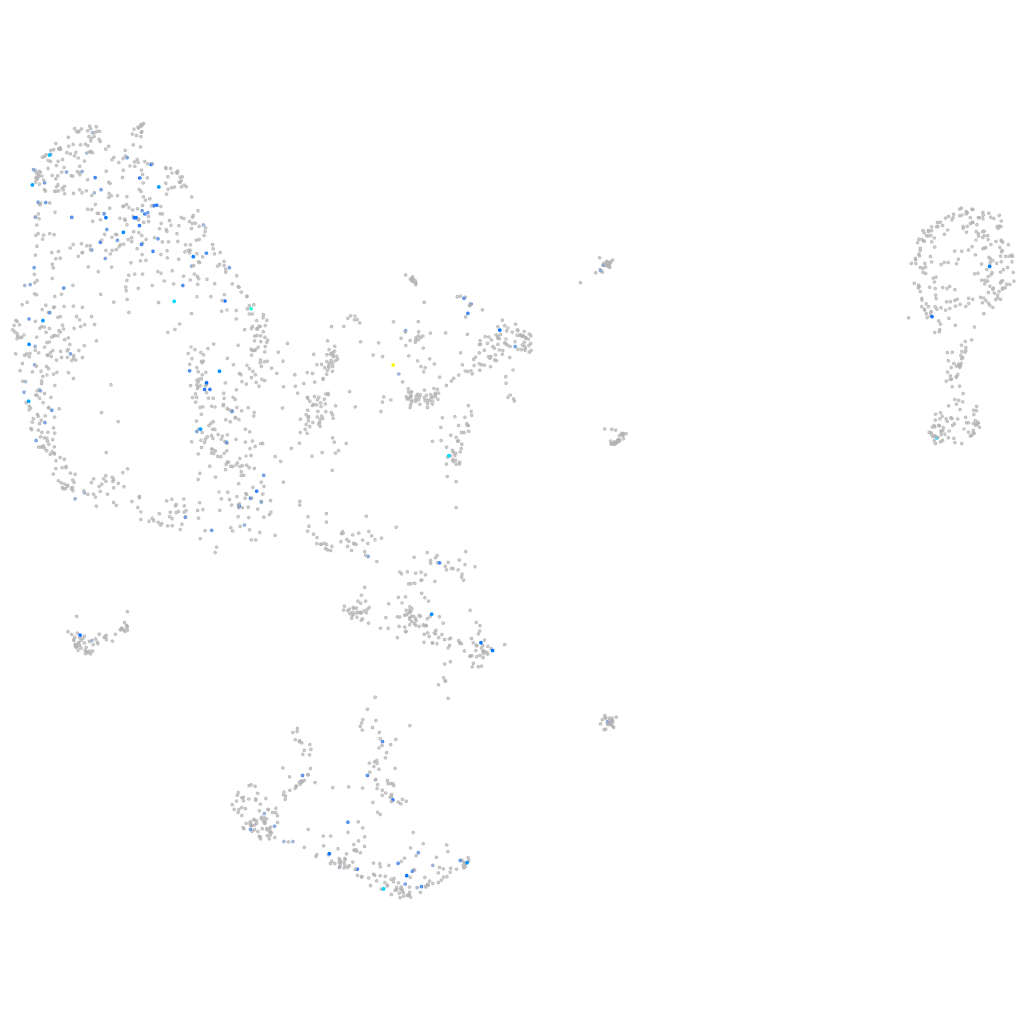
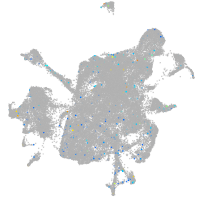
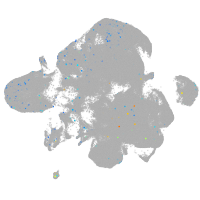
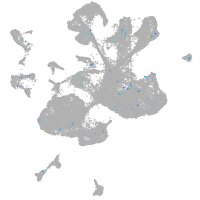
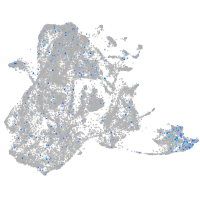
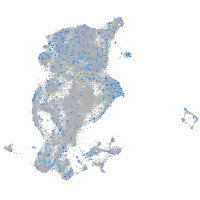
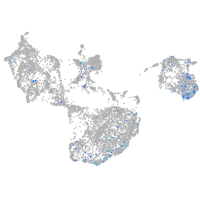
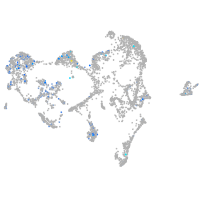
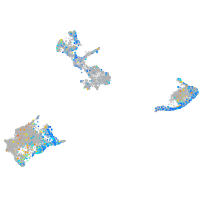
Gene expression UMAP
Display:
Expression
Stage
Other cell groups
all cells
blastomeres
PGCs
endoderm
axial mesoderm
muscle
mural cells /
non-skeletal muscle
mesenchyme
hematopoietic /
vasculature
pronephros
neural
spinal cord / glia
eye
taste / olfactory
otic / lateral line
epidermis
periderm
fin
ionocytes / mucous
pigment cells
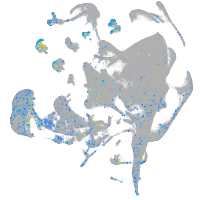
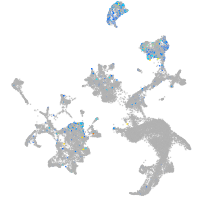
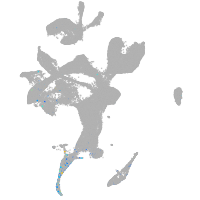
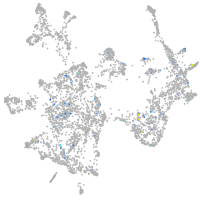
Expression by stage/cluster
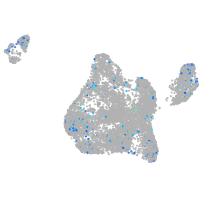
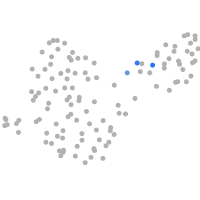
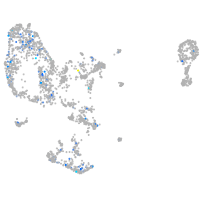
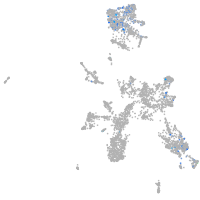
Correlated gene expression
Positive correlation
Negative correlation
Gene
r
Gene
r
ecm1a
0.268
si:ch211-222l21.1
-0.092
pcolceb
0.265
si:ch73-1a9.3
-0.090
zgc:91999
0.259
hmga1a
-0.085
trpm3
0.254
si:ch73-281n10.2
-0.085
AL953886.1
0.234
hdac1
-0.084
si:dkey-93h22.4
0.228
hmgn6
-0.084
LOC558721
0.203
khdrbs1a
-0.082
spx
0.203
hnrnpabb
-0.078
sept4
0.194
h3f3d
-0.076
CT027980.1
0.189
hmgb2a
-0.075
rbp3
0.183
seta
-0.075
CABZ01113830.1
0.181
hnrnpa0a
-0.075
rlbp1b
0.179
srsf3b
-0.074
CABZ01038493.1
0.176
hmgn2
-0.074
myhb
0.175
setb
-0.073
si:dkey-56m15.6
0.173
cirbpb
-0.072
itpripl2
0.166
nucks1a
-0.071
si:ch211-240l19.5
0.166
h2afvb
-0.070
si:ch211-208f21.3
0.165
anp32b
-0.070
irf10
0.161
ruvbl2
-0.069
bmp15
0.159
marcksb
-0.069
s100s
0.158
hspb1
-0.069
zgc:172079
0.156
hnrnpm
-0.068
BX004816.2
0.153
ptmab
-0.068
CR381544.2
0.153
hnrnpaba
-0.068
pygl
0.151
hnrnpub
-0.068
aox5
0.150
phf5a
-0.067
renbp
0.150
lsm3
-0.067
dhrs11b
0.149
hmgb2b
-0.065
LOC101885099
0.146
max
-0.065
slc30a1b
0.146
apoc1
-0.065
BX942819.1
0.145
hnrnpl
-0.064
XLOC-043621
0.145
msna
-0.063
rab38b
0.143
rrp1
-0.062
si:ch211-165b10.3
0.143
hnrnpa1a
-0.062