Daniocell
lipea (mesenchyme)
"lipase, hormone-sensitive a"
ZFIN
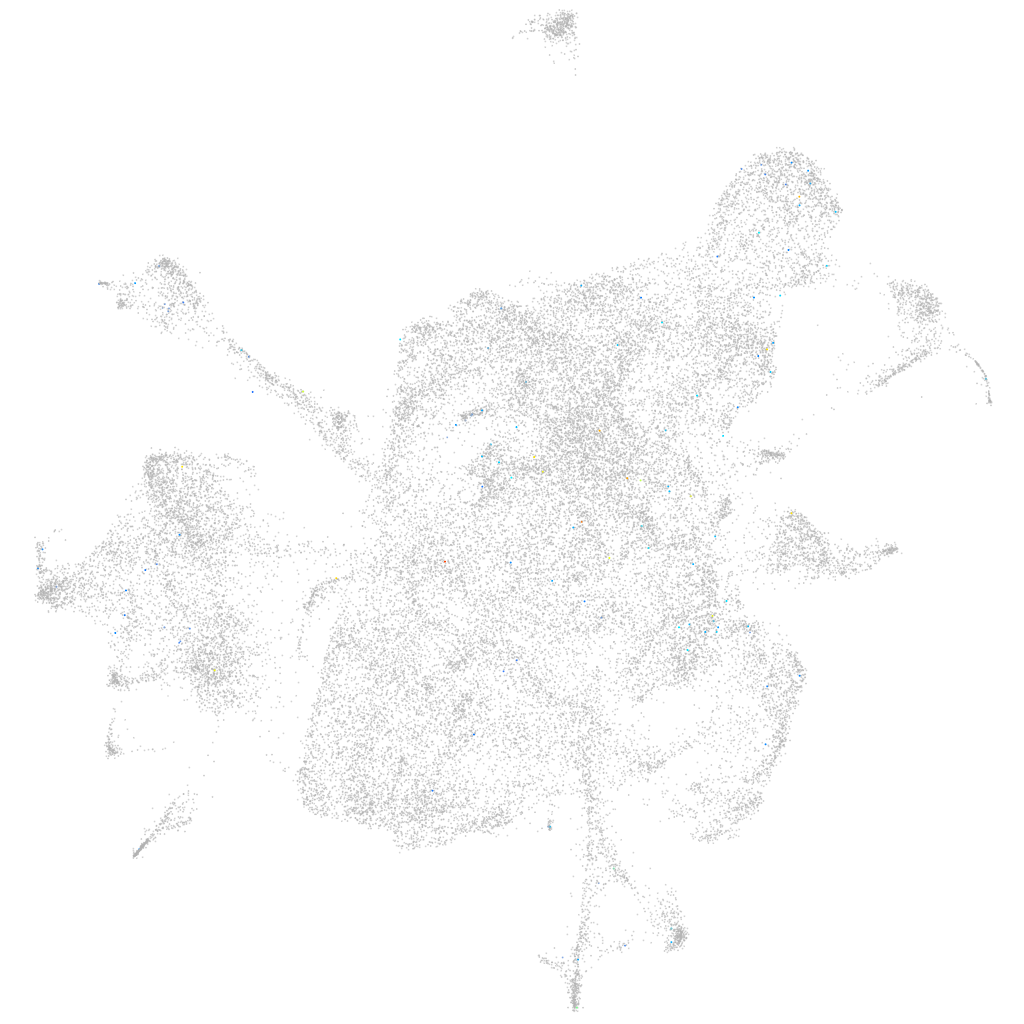
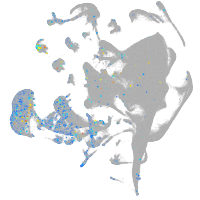
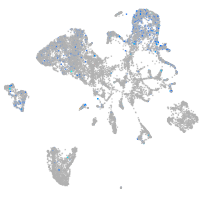
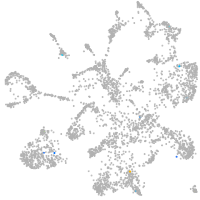
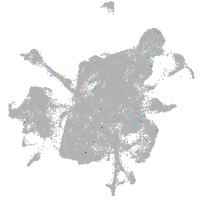
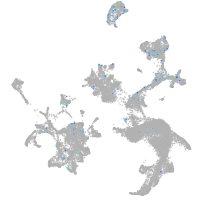
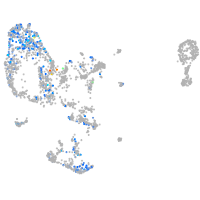
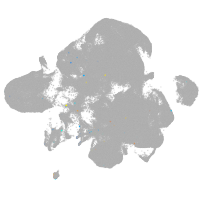
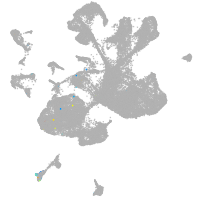
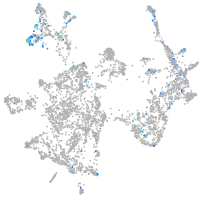
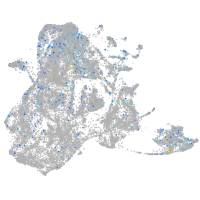
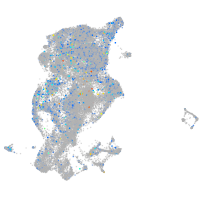
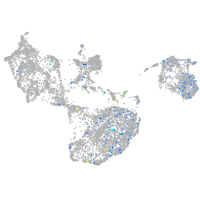
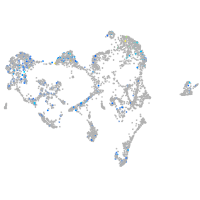
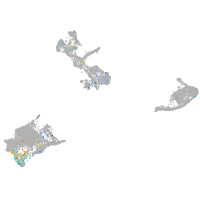
Gene expression UMAP
Display:
Expression
Stage
Other cell groups
all cells
blastomeres
PGCs
endoderm
axial mesoderm
muscle
mural cells /
non-skeletal muscle
mesenchyme
hematopoietic /
vasculature
pronephros
neural
spinal cord / glia
eye
taste / olfactory
otic / lateral line
epidermis
periderm
fin
ionocytes / mucous
pigment cells
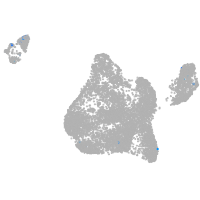
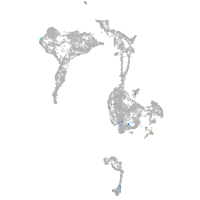
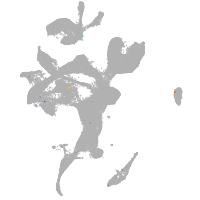
Expression by stage/cluster
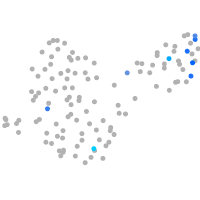
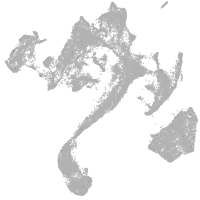
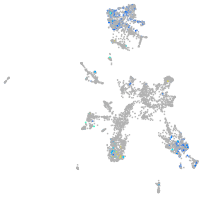
Correlated gene expression
Positive correlation
Negative correlation
Gene
r
Gene
r
FP102073.1
0.152
hmgn2
-0.031
si:dkeyp-85h7.1
0.127
si:ch211-222l21.1
-0.028
CU896644.1
0.103
marcksb
-0.027
cbln14
0.102
si:ch73-1a9.3
-0.027
anks6
0.101
h2afvb
-0.026
si:dkeyp-79b7.12
0.093
rps21
-0.026
si:ch211-113e8.5
0.092
hmgb2a
-0.026
slc22a7b.3
0.092
ptmab
-0.024
rnasel2
0.089
si:ch73-281n10.2
-0.023
zgc:110353
0.088
seta
-0.022
AL935153.1
0.088
nucks1a
-0.022
or115-1
0.087
hmgb3a
-0.022
tesmin
0.085
cirbpb
-0.021
b4galnt3a
0.081
rpl21
-0.021
LOC103911363
0.078
h3f3a
-0.021
LOC103911701
0.078
hmgb2b
-0.021
LO017816.1
0.069
hmga1a
-0.021
XLOC-039631
0.064
hmgn6
-0.021
LOC110440213
0.063
lsm6
-0.020
zgc:153681
0.062
zgc:153409
-0.020
si:dkey-22l1.1
0.061
ddx61
-0.020
si:ch211-250e5.2
0.058
cirbpa
-0.020
LOC108182577
0.057
snrpe
-0.020
si:ch73-334d15.2
0.056
khdrbs1a
-0.019
XLOC-025689
0.056
ilf2
-0.019
si:dkey-26i13.6
0.056
h2afva
-0.019
XLOC-026578
0.056
snrpd3l
-0.018
LOC108180193
0.055
h3f3d
-0.018
LOC110438338
0.055
snrpd2
-0.018
tdrd1
0.055
hnrnpa1b
-0.018
wnt5a
0.054
snrpb
-0.018
ftr14l
0.053
zbtb16a
-0.018
XLOC-041047
0.052
psma6a
-0.018
arap1
0.050
si:dkey-151g10.6
-0.018
cd44a
0.048
mcm7
-0.017